Excelgoodies logo +1 650 491 3131

Certified Courses for

Master Next-Gen Data Engineering

Data Engineering &
Full Stack BI: Fabric (On-Cloud)

Microsoft Fabric | Power BI | SQL | Lakehouse | Data Factory (Pipelines) | Dataflows Gen2 | KQL | Delta Tables | Power Apps | Power Automate

(1.5K+ Professionals enrolled)

Prove you're human: Type the code shown.

=
Excelgoodies

By clicking any of the above buttons, I agree to the terms & conditions and privacy policy, and I consent to receive updates via SMS or email

Program Overview

Training Schedule

Tuesday, 11 Apr

View Schedule

8 Weeks | 74 Hours

37 Sessions, 2 Hrs Each

Live Online, Instructor-Led

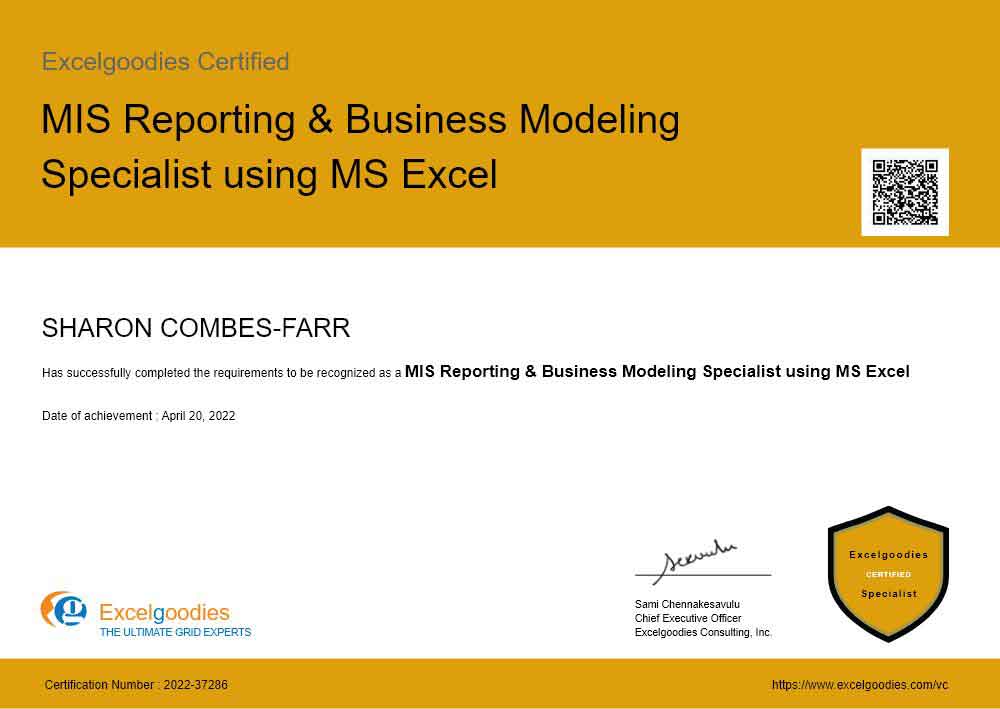
Certificates

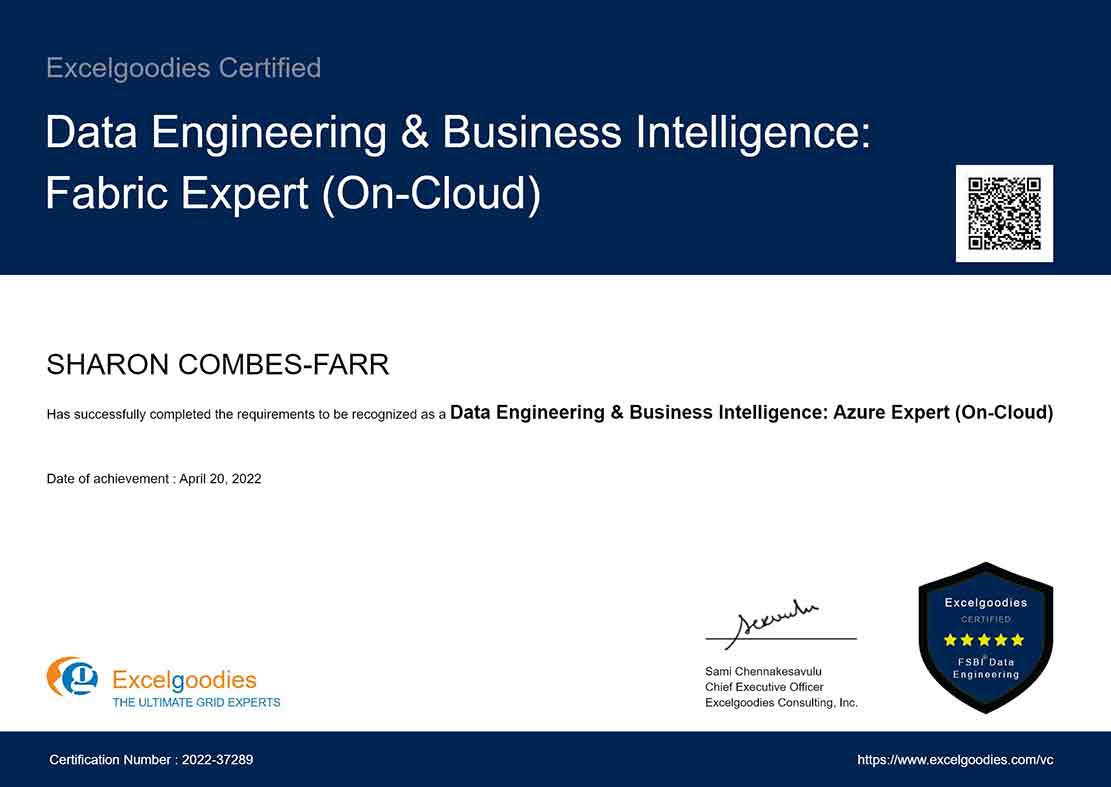
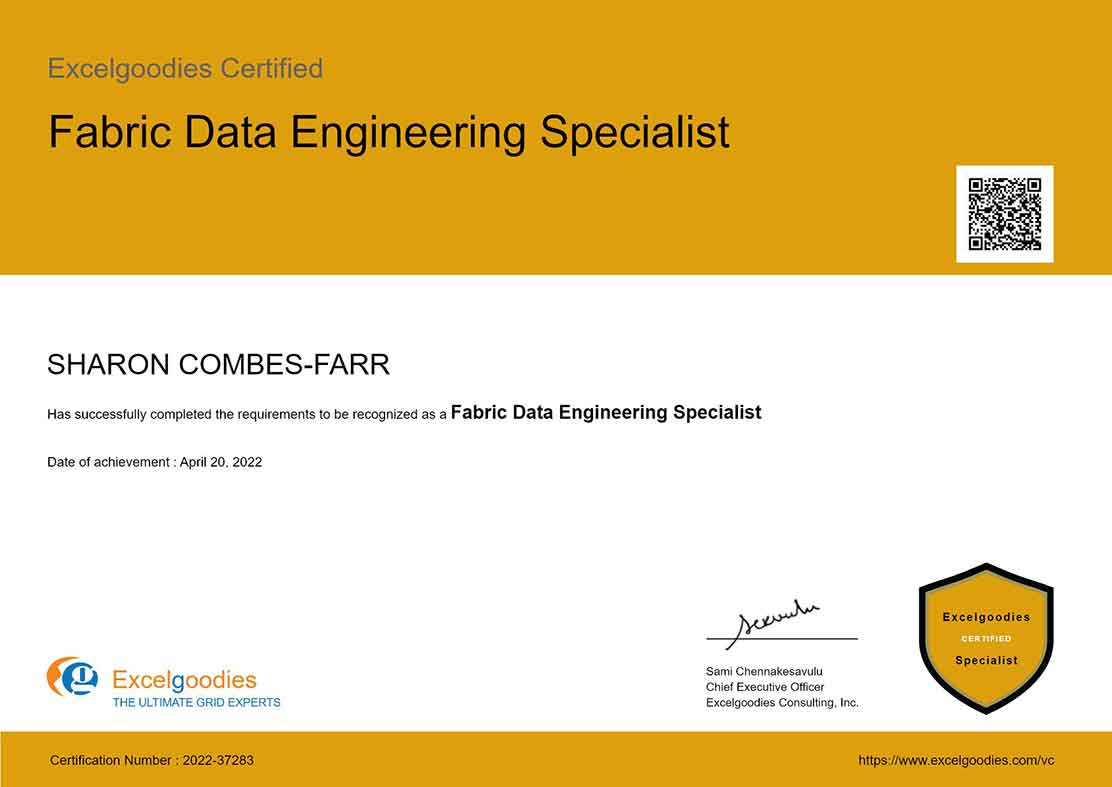
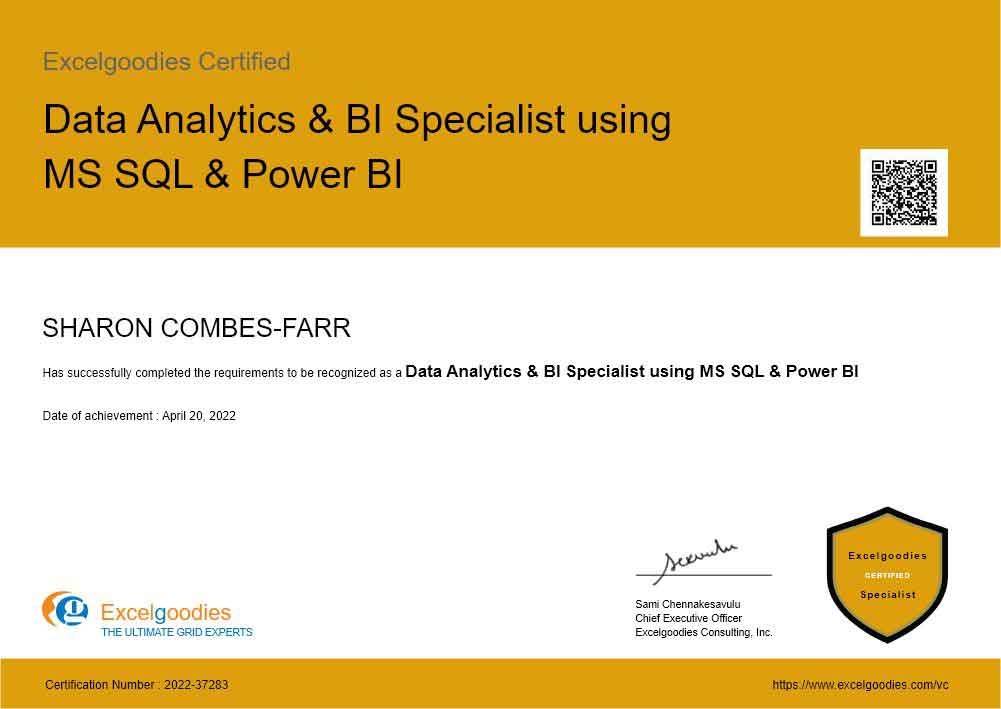
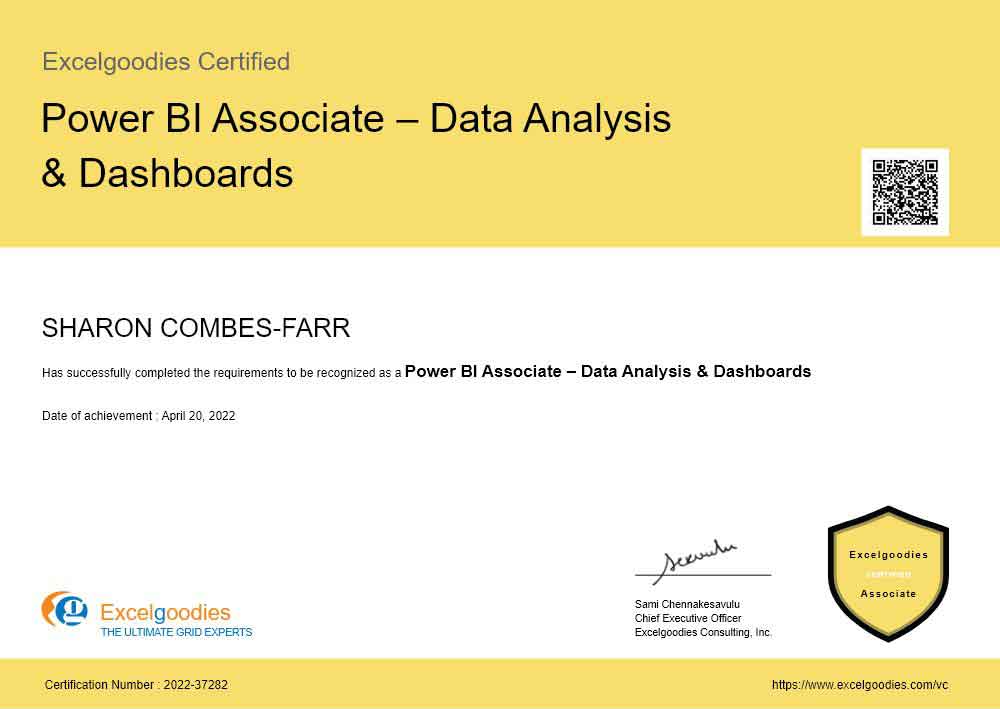
7 Specialist Certificates

View Certificate Details

Course Fee

$2999

Check what’s included?
floating_menu floating_menu floating_menu

Batch starts on

th

For Next-Gen Cloud BI & Data Engineers

Fabric Data Engineering + Power BI + Unified Cloud + AI Automation

The Future of Data Engineering for Next-Gen Professionals.

This course is for professionals ready to lead the future of data engineering. Master end-to-end data workflows with Fabric, including data ingestion, Power BI, AI automation, and tools like Lakehouse, KQL Analytics, and Python. Whether you're new to data engineering or looking to advance your skills, this course equips you with the expertise to thrive in an ever-changing field.

Tools You'll Learn

Visualization Tool

Power BI

App Development

Power Apps

Automation Tool

Power Automate

Cloud Workflows

Data Pipelines (Fabric)

Warehouse Tool

Data Warehouse (Fabric)

Data Modeling

DAX

Data Prep Tool

Dataflows Gen2

Pipeline Tool

Data Factory (in Fabric)

Cloud Platform

Microsoft Fabric

Query Language

SQL / KQL

Lakehouse Tool

Lakehouse (Fabric OneLake)

Scripting Language

Python

In just 8 weeks, you'll be able to:

Build End-to-End Data Pipelines – Orchestrate data workflows using Data Factory and Eventstream.

Manage Cloud Data Infrastructure – Use OneLake and Data Warehouse for seamless data storage and retrieval.

Create Advanced BI Dashboards – Develop interactive reports with Power BI and DAX.

Automate Data Workflows – Streamline processes with Power Automate and Dataflows Gen2.

Perform Advanced Data Analytics – Leverage KQL Analytics for real-time insights.

Integrate BI with Apps – Connect Power Apps, Power Automate, and Power BI for end-to-end automation.

Ideal For:

fullstack courses

Cloud Data Engineers

Building and managing scalable data pipelines with Fabric.

fullstack courses

BI Professionals

Enhancing cloud-based BI skills and automation.

fullstack courses

Data Analysts

Mastering data engineering workflows and cloud analytics.

fullstack courses

Automation Specialists

Streamlining data processes and reporting with AI tools.

fullstack courses

Enterprise Architects

Designing scalable cloud-native data solutions.

fullstack courses

Tech Leaders & Decision Makers

Adopting advanced data engineering tools for business transformation.

A snapshot of what you'll be learning in 8-weeks.

Course Syllabus Overview

Advanced Charting Techniques

The Science of Chart Choice
  • Decode the intent behind visuals: comparison, distribution, trend, or composition
  • Know when to use Clustered vs Stacked vs 100% Column Charts
  • Choose the right axis, scale, and layout based on your message
  • Avoid misleading visuals and cluttered dashboards
Smart Charting Techniques
  • Master column, bar, line, area, and combo charts with use-case depth
  • Conditional charts to highlight exceptions, variances, or risk points
  • Use formulas to drive attention: Top N, outliers, or KPI status
Data Storytelling Framework
  • Learn the 3-layer structure: Data → Insight → Impactful Visual
  • Build visuals that answer business questions, not just decorate reports
  • Turn dry tables into executive-ready visuals
Interactive & Dynamic Charting
  • Drop-down-driven visuals for user-led exploration
  • Pivot-linked visuals for real-time insights
  • Use slicers and timelines like a pro
Design for Interpretation
  • Clean layout, minimal ink, maximum clarity
  • Design tricks: focus colors, white space, custom labels, layering
  • Chart templates for consistency across reports

Quick Excel brush-up

Fundamentals Of Functions & Formulas Quick techniques to work with formulas & functions DATE AND TIME FUNCTIONS For data and time calculations
  • Today, Now
  • Day, Month, Year
  • Date, DateDif, DateAdd
  • EOMonth, Weekday
  • Workdays, NetWorkdays, Edate
TEXT FUNCTIONS For data transformations
  • Upper, Lower, Proper
  • Left, Mid, Right
  • Trim, Len
  • Concatenate
  • Find, Substitute
LOGICAL FUNCTIONS For conditional statement development
  • Nested If ( And Conditions , Or Conditions )
  • Alternative Solutions for Complex IF Conditions to make work simple
  • And, Or, Not
MATHEMATICAL FUNCTIONS For fundamental analysis
  • Sum, Count, CountA, Average, AverageA, Max & Min
  • SumIf, SumIfs
  • CountIf, CountIfs
  • AverageIf, AverageIfs
  • MaxIfs, MinIFs
LOOKUP FUNCTIONS For joins with multiple tables
  • Vlookup / HLookup
  • Match
  • Dynamic Two Way Lookup
  • Creating Smooth User Interface Using Lookup
  • Offset
  • Index
  • Dynamic Worksheet linking using Indirect
ERROR HANDLING FUNCTIONS For handling errors in functions

Power BI

Building Blocks of Power BI
  • Visualizations
  • Datasets
  • Reports
  • Dashboards
  • Tiles
Building Your First Power BI Report
  • Connect to Data Sources in Power BI Desktop
  • Clean and Transform Your Data With the Query Editor
  • Create a report in Power BI Desktop
  • Publish the report in the Power BI service
Data Modelling with Power BI
  • Fundamentals of Modelling
  • How to Manage Your Data Relationships
  • Create Calculated Columns
  • Optimizing Data Models for Better Visuals
  • Create measures and work with time-based functions
  • Create Calculated Tables
  • Explore Time-Based Data
Visualizations
  • Create and Customize Simple Visualizations
Building compelling data visualizations
  • Identify metrics and pair them with appropriate data visuals
  • Using slicers
  • Creating Map Visualizations
  • Creating Tables and Matrixes
  • Creating Waterfall and Funnel Charts
  • Using Gauges and Single Number Cards
  • Charting Options including Formatting with Colors, Shapes, Text Boxes, Images, etc.
Designing User-friendly reports
  • Customize themes
  • Create versatile layouts for your reports
  • Design principles to reduce noise and highlight data stories
Creating interactive reports for data exploration
  • Filtering & drilling for insights
  • Difference between filters & slicers
  • Filter pane for reporting needs

Power Query

Overview
  • Introduction
  • Loading & Refresh
  • Combine data from multiple data sources
Data Transformation
  • Editing Queries Created with Power Query
  • Editing Column Headers in Power Query
  • Splitting Column Data with Power Query
  • Sorting Data
  • Multi-Level Sorting
  • Filtering Data
  • Aggregate data from a column
  • Insert a custom column into a table
  • Merge columns
  • Remove columns
  • Remove rows with errors
  • Promote a row to column headers
  • Transforming Text Values
  • Replacing Data
  • Using the Fill command
  • Pivot and Unpivot Column
  • Transpose Query Data
  • Pivot Column Command in Action
  • Unpivot Columns Command
  • Grouping Data
  • Create a Duplicate Query
  • Group and Summarize Data
  • Advanced Data Grouping
  • Working with multiple sources in Power Query
  • Multiple Excel Tables
  • Expand a column containing an associated table
  • Understanding Table Relationships
  • Merging Queries
Loading Power Query Data to Destinations
  • Familiarity with the Load & Refresh Settings
  • Loading it to Workbook
  • Loading it to Data Model

DAX Functions

Overview
  • What is DAX?
  • Data Types
  • Table-Valued Functions
  • Building a Calendar Table
  • Date and Time Functions
  • Filter Functions
  • Information Functions
  • Logical Functions
  • Mathematical and Trigonometric Functions
  • Statistical Functions
  • Text Functions
  • Time Intelligence Functions
  • Creating Advanced DAX Measures With Advanced DAX Functions
Creating Advanced Dax Measures With Advanced Dax Functions
  • Calculate()
  • All()
  • Filter()
  • IF()
  • Switch()
  • SumX()
Evaluation Context
  • Filter Context
  • Row Context
  • Using RELATED in a Row Context
  • Filters and Relationships
  • USERELATIONSHIP
Hierarchies in DAX Querying with DAX Relationships
  • One-to-Many Relationships
  • Many-to-Many Relationships

Advanced DAX Functions

ADVANCED DAX FUNCTIONS ADVANCED CONTEXT CONCEPTS
  • Understanding and Debugging Context Transition
  • Expanded Tables and Filter Propagation
  • Using VAR for Performance and Clarity
  • Using TREATAS() to Apply Filters Between Unrelated Tables
  • Virtual Relationships using DAX
  • Shadow Filters and Filter Overriding Techniques
ADVANCED CALCULATION PATTERNS
  • Running Totals with Custom Filter Logic
  • Rolling Averages (e.g., 7-day, 12-month)
  • Year-over-Year (YoY), Quarter-over-Quarter (QoQ), MoM with Non-Standard Calendars
  • Top N Reporting with Others Grouping
  • Parent-Child Hierarchy Navigation using PATH, PATHITEM, PATHLENGTH
  • Budget vs. Actual Comparison Patterns
  • Custom Grouping (Bucketing) in DAX
ADVANCED TIME INTELLIGENCE
  • Semi-Additive Measures (e.g., Closing Balance, Opening Balance)
  • Workdays and Custom Holiday Calendars
  • Dynamic Period Selection (MTD, QTD, YTD) based on Slicers
  • Cumulative Totals Across Multiple Tables or Years
ADVANCED FILTER + CALCULATE PATTERNS
  • Multiple Filters in a Single CALCULATE
  • Using NOT, EXCEPT, INTERSECT inside CALCULATE
  • Combine CALCULATE with FILTER(), VALUES(), ALLSELECTED(), KEEPFILTERS()
RELATIONSHIP MODELING TECHNIQUES
  • Virtual Relationships using DAX (TREATAS, LOOKUPVALUE)
  • USERELATIONSHIP vs. CROSSFILTER
  • Handling Bi-Directional Relationships with Care
  • Many-to-Many Solutions using DAX with Bridge Tables
PERFORMANCE OPTIMIZATION
  • Understanding and Using DAX Studio and VertiPaq Analyzer
  • Optimizing Calculated Columns vs. Measures
  • Query Plans and Storage Engine vs. Formula Engine
  • Cardinality and its impact on performance
  • Avoiding common DAX performance anti-patterns (e.g., misuse of SUMX inside FILTER)
DEBUGGING AND TESTING
  • Using DEFINE MEASURE and EVALUATE in DAX Studio
  • Evaluating DAX logic step-by-step with VAR and RETURN
  • Tools: Performance Analyzer in Power BI
SPECIAL FUNCTIONS AND USE CASES
  • GENERATE(), GENERATEALL(), ADDCOLUMNS()
  • SUMMARIZE(), SUMMARIZECOLUMNS(), GROUPBY()
  • ISINSCOPE(), SELECTEDVALUE() vs VALUES()
  • RANKX(), TOPN(), PERCENTILEX.INC
  • CONTAINS(), LOOKUPVALUE(), RELATEDTABLE()

SQL Querying

Introduction to MS-SQL
  • Creating a Database
  • Understanding Tables and Creating Tables
  • Inserting, Updating and Deleting Data
  • Querying Data
  • Filtering Data
  • Grouping Data
  • Ordering Data
  • Column Aliases
  • Table Aliases
DDL INSIGHTS
  • CREATE TABLE
  • Dropping Objects
  • CREATE INDEX
  • TEMPORARY OBJECTS
  • Object Naming and Dependencies
SELECT STATEMENTS
  • Simple SELECTs
  • Calculated and Derived Fields
  • SELECT TOP / BOTTOM Records
  • Derived Tables
  • Joins
  • Predicates
  • Subqueries
  • Aggregate Functions
  • GROUP BY and HAVING
  • UNION
  • ORDER BY

SQL Programming

DDL INSIGHTS
  • CREATE TABLE
  • Dropping Objects
  • TEMPORARY OBJECTS
  • Object Naming and Dependencies
INTRODUCTION TO SQL PROGRAMMING (T-SQL)
  • What is T-SQL?
  • Differences between SQL Querying and SQL Programming
  • Benefits of procedural SQL
  • Use cases in reporting, automation, and ETL
VARIABLES AND CONTROL STRUCTURES
  • Declaring and Using Variables (DECLARE, SET)
  • Conditional Logic: IF…ELSE
  • Loops: WHILE, BREAK, CONTINUE
  • Error Handling: TRY…CATCH, THROW
  • GOTO statement (rare but useful for certain scenarios)
USER-DEFINED FUNCTIONS (UDFs)
  • Scalar-Valued Functions
  • Table-Valued Functions (Inline and Multi-statement)
  • Best practices for performance
  • Use in SELECT, WHERE, JOIN clauses
STORED PROCEDURES
  • Creating and Executing Stored Procedures
  • Input Parameters, Output Parameters
  • Reusability and Modularity
  • Nested Stored Procedures
  • Use in ETL and Reporting pipelines
TEMPORARY AND TABLE VARIABLES
  • Temporary Tables (#Temp, ##GlobalTemp)
  • Table Variables (DECLARE @TableVar TABLE)
  • Differences, Use Cases, and Scope
  • CTEs (Common Table Expressions)
CURSORS
  • Introduction to Cursors
  • Declaring and Using Cursors
  • Static vs Dynamic Cursors
  • Use Cases and Performance Considerations
DYNAMIC SQL
  • Constructing SQL Statements on the Fly
  • Executing with EXEC() and sp_executesql
TRANSACTIONS AND ERROR HANDLING
  • Introduction to Transactions
  • BEGIN TRAN, COMMIT, ROLLBACK
  • Nesting Transactions
  • Isolation Levels
  • Locking and Blocking
TRIGGERS
  • AFTER INSERT, AFTER UPDATE, AFTER DELETE
  • INSTEAD OF Triggers
  • Auditing Changes
  • Performance considerations
TESTING AND DEBUGGING
  • PRINT Statements
  • RAISERROR for debugging
  • SQL Server Profiler / Extended Events (if applicable)
  • Debugging in SQL Server Management Studio (SSMS)

Power BI Administration

Objective: Get hands-on experience with advanced administration settings, permissions, Data refresh times etc.

Overview

  • Publishing Power BI Reports
  • Creating & Managing Workspaces and Its Access
  • Creating & Managing Dashboard and Its Access
  • Installing & Configuring Data gateway
  • Scheduling and configuring data refresh
  • Managing & Reusing Datasets
  • Scheduling Report Alerts
  • Setting up Row Level Permissions
  • Managing Users & Audit Log
  • Custom Branding Power BI For your Organization
  • Adding Custom Visuals for your Organization

Microsoft Fabric and Power BI Ecosystem

  • Introduction to Microsoft Fabric architecture and vision
  • Understanding the unified platform concept of Fabric
  • Overview of Fabric modules: Lakehouse, Warehouse, Real-Time Analytics, Data Activator, Data Science
  • Exploring OneLake as the single data lake for all workloads
  • Introduction to DirectLake and how it changes Power BI performance
  • Power BI's deep integration into the Fabric platform
  • Comparison of Fabric with legacy tools (Synapse, Dataflows, Data Factory)
  • Navigating Fabric workspaces, domains, and permissions
  • Understanding Fabric's role in end-to-end data lifecycle
  • Licensing structure and Fabric capacities
  • Fabric as an evolution of Azure Synapse and Power BI Premium
  • Cross-module data sharing within Fabric
  • Use of Notebooks and Spark runtime for data professionals
  • Understanding Fabric in the context of business intelligence
  • Connecting Power BI Desktop to Fabric datasets and models

Microsoft Fabric: Data Modeling with Fabric Lakehouse

  • Introduction to Lakehouse and its architecture
  • Differences between Lakehouse and traditional data lakes
  • Creating Lakehouse objects: managed vs unmanaged tables
  • Loading data using Dataflows Gen2 into Lakehouse
  • Delta Lake format and its benefits for performance and reliability
  • Schema management and table partitioning
  • Working with notebooks in Lakehouse for transformations
  • Using Spark to process and refine raw data
  • Connecting Power BI to Lakehouse via DirectLake
  • Creating semantic models from Lakehouse tables
  • Best practices for folder structures and naming conventions
  • Lakehouse security and access control in Fabric
  • Performance optimization for large data models in Lakehouse
  • Versioning and auditability in Lakehouse data
  • Integrating Lakehouse data into Power BI dashboards

Microsoft Fabric: Data Modeling with Fabric Data Warehouse

  • Introduction to the Fabric Data Warehouse module
  • Understanding structured modeling vs Lakehouse
  • Creating Warehouse tables, views, stored procedures
  • Building star schemas and dimensional models
  • Data ingestion into Warehouse using pipelines or Dataflows
  • Best practices for table relationships and indexing
  • Optimizing DAX performance on Warehouse models
  • Creating and querying views for report consumption
  • Understanding DirectQuery vs DirectLake vs Import modes
  • Connecting Power BI to Fabric Data Warehouse
  • Warehouse data governance and role-based access control
  • Integrating Warehouse and Lakehouse models in one dataset
  • Use cases for Warehouse vs Lakehouse
  • Monitoring and auditing Warehouse usage
  • Data lineage and impact analysis within Fabric Warehouse

Microsoft Fabric: Developing Reports and Dashboards Fabrics

  • Connecting Power BI to Lakehouse and Warehouse datasets
  • Building semantic models with measures, columns, hierarchies
  • Designing star schema datasets for optimal performance
  • Creating dynamic visuals: charts, tables, KPI cards
  • Using bookmarks, slicers, drillthrough, and tooltips
  • Creating interactive navigation experiences in Power BI
  • Implementing row-level and object-level security
  • Using custom visuals for advanced reporting needs
  • Formatting reports with branding and design standards
  • Designing mobile-friendly Power BI dashboards
  • Creating paginated reports for pixel-perfect outputs
  • Embedding reports in web apps or Teams environments
  • Using Q&A and AI visuals for smart exploration
  • Performance tuning with Aggregations and Composite Models
  • Publishing, sharing, and certifying reports within Fabric workspaces

Microsoft Fabric: Real-Time Analytics in Fabric

  • Introduction to KQL (Kusto Query Language)
  • Creating Real-Time Analytics databases in Fabric
  • Ingesting streaming data from multiple sources
  • Defining data ingestion policies for real-time datasets
  • Querying KQL databases from Power BI
  • Designing dashboards for real-time metrics
  • Use cases: IoT, web analytics, stock prices, sales live feed
  • Setting up alerts and thresholds with Data Activator
  • Comparing Real-Time Analytics with traditional BI
  • Managing ingestion latency and data freshness
  • Visualizing real-time vs near real-time data
  • Securing KQL datasets and managing access
  • Building composite models with real-time + historical data
  • Scaling real-time dashboards with large volume streams
  • Monitoring and logging for KQL and streaming performance

Microsoft Fabric: Advanced Topics

  • Power BI Governance in Fabric: certification, endorsement, monitoring
  • Deployment pipelines for Dev ➝ Test ➝ Prod
  • Workspace and artifact-level permission strategies
  • Advanced RLS and OLS implementations
  • Performance optimization with VertiPaq Analyzer and DAX Studio
  • Version control and change tracking in Fabric environments
  • Incremental refresh in DirectLake and hybrid models
  • Power BI Composite and Hybrid models explained
  • Creating semantic calculation groups and perspectives
  • Automating report workflows using Power Automate
  • Using Data Activator for rule-based triggers and alerts
  • Audit logging and activity monitoring in Fabric tenant
  • Capacity management and Fabric licensing optimization
  • Using Fabric with external tools: Excel, Azure Data Explorer, Synapse
  • Building reusable report templates and model layers for enterprise use

Data Engineering: Microsoft Fabric Enterprise Architecture and Integration

  • Deep dive into Microsoft Intelligent Data Platform and Fabric’s role
  • OneLake metadata, multi-format storage, and virtualization
  • Cross-domain architecture and enterprise data mesh strategies
  • Fabric vs Synapse vs Azure Data Lake Gen2 vs Databricks: Advanced comparison
  • Advanced workspace security architecture and cross-tenant collaboration
  • Resource governance with Fabric capacities and metrics analysis
  • Managed identity integration and token-based access with Azure AD
  • DevOps enablement using YAML pipelines and Fabric REST APIs
  • Establishing CI/CD frameworks across Fabric workspaces
  • Enterprise project structuring and naming conventions
  • Hybrid deployment models: Fabric + Azure Synapse + Databricks
  • Licensing optimization and multi-sku capacity design
  • Cross-region failover design with global distribution
  • Integration with Microsoft Purview for data cataloging and governance
  • Enterprise-wide telemetry, lineage, and impact analysis in Fabric

Data Engineering: Advanced Data Ingestion and Workflow Orchestration

  • Designing scalable multi-source ingestion using Pipelines
  • Handling unstructured, semi-structured, and nested JSON/XML ingestion
  • High-throughput ingestion patterns with partition and parallelism
  • Data movement between Lakehouse, Warehouse, and external stores
  • Metadata-driven ingestion framework using dynamic mapping
  • Automating schema drift detection and schema evolution
  • Event-based triggering, watermarking, and incremental pipeline logic
  • CI/CD for pipeline artifacts using YAML + Git integration
  • Auto-healing and recovery patterns in critical workflows
  • Performance diagnostics, retry patterns, and load distribution
  • On-demand ingestion pipelines using REST API and webhook
  • Creating metadata registries and data quality layers
  • Delta loading with deduplication and upsert logic
  • Ingestion cost modeling and Fabric throughput planning
  • Integration with Power Automate for orchestrated alerting

Data Engineering: Lakehouse Engineering & Distributed Big Data Processing

  • Architecting petabyte-scale Lakehouses with optimized partitions
  • Advanced PySpark for ETL, joins, windowing, and batch refinement
  • Spark performance tuning with broadcast joins and caching strategies
  • Leveraging Delta Lake time travel and vacuum operations
  • Structured Streaming with notebooks for near real-time prep
  • Managing schema evolution in high-churn Lakehouses
  • Auto-loading from streaming pipelines into Lakehouse
  • Secure file storage, data masking, and object-level control
  • Access control via workspace roles, ACLs, and token-scoped URIs
  • Delta Live Tables (DLT)-style modeling using Fabric Pipelines + Spark
  • Data lifecycle management, versioning, and retention policies
  • Using notebooks to orchestrate Fabric-native ML feature stores
  • Spark SQL vs T-SQL: Fabric interoperability best practices
  • Integrating Databricks Delta tables with Fabric Lakehouse (interop)
  • Publishing refined Lakehouse models for cross-workspace consumption

Data Engineering: Advanced Data Warehouse Engineering in Fabric

  • Multi-model schema deployment using T-SQL and templates
  • Advanced table storage patterns (columnstore, rowstore, hybrid)
  • Query folding, execution plan tuning, and materialized views
  • Synapse-to-Fabric migration patterns for Warehouse workloads
  • Multi-zone Warehouse design: Staging, Curation, Semantic Zones
  • Data snapshots, CDC, and Slowly Changing Dimensions (SCD Types 1/2/3)
  • Warehouse lineage tracking using Fabric catalog and logs
  • Partitioned table design and lifecycle policy enforcement
  • Schema-bound views vs open views and indexing strategies
  • Managing Warehouse with GitOps and Deployment Pipelines
  • Storing audit logs and temporal data for forensic analysis
  • Integrating Power BI composite models with multiple Warehouses
  • Monitoring long-running queries, auto-cancel, and workload isolation
  • Automated tests and validation of Warehouse pipelines
  • Secure sharing of Warehouse models via Fabric domains and endorsements

Data Engineering: Real-Time Data Engineering and Advanced KQL Analytics

  • High-velocity streaming ingestion with Fabric KQL + Event Hub
  • Designing low-latency architectures with warm and hot paths
  • KQL functions, macros, and materialized views for high-frequency queries
  • Time-series modeling and outlier detection in KQL
  • Writing efficient joins, summarize, parse, and mv-expand statements
  • Stream aggregation with windows, tumbling, and hopping
  • Advanced ingestion policies with batch triggers and auto-purge
  • Integration with IoT, telemetry systems, and Azure Stream Analytics
  • Building reusable streaming dashboards with Power BI and KQL
  • Securing KQL DB with RBAC, audit trails, and managed identities
  • Retention and hot-cold tiering for streaming archives
  • Monitoring ingestion health and latency SLAs
  • Creating composite real-time + historical BI models
  • Triggering Power Automate flows from KQL outputs
  • Cost optimization and resource planning for KQL workloads

Data Engineering: Semantic Modeling, Governance, and Power BI at Scale

  • Designing enterprise-wide semantic models on Lakehouse/Warehouse
  • Composite model architecture and DirectLake dataset design
  • Row-Level, Object-Level, and Field-Level security patterns
  • Building reusable calculation groups, perspectives, and templates
  • Dataset certification workflow and publishing governance
  • Managing refresh schedules, incremental loading, and query caching
  • Scaling Power BI for thousands of users and distributed teams
  • Monitoring model usage, report telemetry, and capacity health
  • Automating deployment pipelines for datasets and reports
  • Using XMLA endpoint for external governance tools
  • Power BI API and service principal authentication for devops
  • Admin monitoring, audit logs, and tenant-level insights
  • Deployment rollback, dataset versioning, and failover models
  • Curated workspace provisioning using Azure Automation + Fabric API
  • Aligning Power BI governance with Microsoft Purview and compliance

Power Apps

INTRODUCTION TO POWER APPS

Overview of Power Apps

  • What is Power Apps?
  • Benefits and use cases
  • Types of Power Apps: Canvas, Model-Driven, and Portal Apps

Getting Started

  • Setting up your Power Apps environment
  • Navigating the Power Apps interface

DATA INTEGRATION AND MANAGEMENT

Connecting to Data Sources

  • Introduction to connectors
  • Connecting to common data sources (SharePoint, Excel, SQL Server, etc.)

Managing Data

  • Understanding data tables and collections

BUILDING YOUR FIRST CANVAS APP

Basics of Canvas Apps

  • Understanding Canvas Apps
  • Creating a simple Canvas App
  • Adding screens and navigation
  • Creating simple app to view details from data source.
  • Using simple forms to display and edit data

ADVANCED CANVAS APP FEATURES

User Experience Design

  • Designing responsive layouts
  • Using themes and templates
  • Best practices for user interface design

Working with Controls

  • Using different types of controls like
  • Button
  • Text input
  • Drop down
  • Combo Box
  • Date picker
  • List box
  • Radio
  • Text label
  • Vertical gallery
  • Horizontal gallery
  • Flexible height gallery
  • Blank Vertical gallery
  • Blank Horizontal gallery
  • Blank Flexible height gallery
  • Data table
  • Horizontal container
  • Vertical container
  • Container
  • Image
  • Icons
  • Shapes
  • Working with control properties

Working with Variables

  • Global variables
  • Context variable
  • Collections

Using formulas for dynamic form management

  • Functions to be used in forms
  • SubmitForm
  • EditForm
  • Clear
  • ClearCollect
  • Collect
  • Filter
  • If
  • Navigate
  • NewForm
  • Notify
  • Patch
  • Refresh
  • Search
  • Set
  • Text
  • ThisItem
  • Value

Advanced Controls and Features

  • Working with media (images, videos)
  • Implementing charts and graphs
  • Using Power Automate for workflows

Understanding the Common Data Service (Dataverse)

  • Creating entities and relationships
  • Building a simple Model-Driven App

SECURITY AND ADMINISTRATION

  • Security in Power Apps

Understanding security roles and permissions

  • Implementing data security

App Management

  • Managing app versions
  • Publishing and sharing apps

BEST PRACTICES AND ADVANCED TOPICS

  • Performance Optimization
  • Tips for improving app performance
  • Debugging and troubleshooting techniques
  • Real-World Use Cases

REALTIME PROJECTS

  • Project 1: Employee Leave Request App
  • Project 2: Inventory Management App
  • Project 3: Customer Feedback App
  • Project 4: Project Management Dashboard
  • Project 5: Sales Order Processing App

Power Automate

INTRODUCTION TO POWER AUTOMATE

Overview of Power Automate

  • What is Power Automate?
  • Benefits and use cases
  • Types of flows: Cloud Flows, Desktop Flows, and Business Process Flows

Getting Started

  • Setting up your Power Automate environment
  • Navigating the Power Automate interface

CREATING YOUR FIRST FLOW

Basics of Flow Creation

  • Understanding triggers and actions
  • Creating a simple flow
  • Running and testing flows

Flow Templates

  • Using predefined templates
  • Customizing template flows
  • Best practices for using templates

WORKING WITH CONNECTORS

Introduction to Connectors

  • Understanding connectors and their roles
  • Connecting to common data sources (SharePoint, OneDrive, Outlook, etc.)

Advanced Data Integration

  • Using premium connectors
  • Connecting to SQL Server, Azure, and other advanced data sources

ADVANCED FLOW FEATURES

Conditions and Loops

  • Implementing conditional logic
  • Using loops for repetitive tasks

Approvals and Notifications

  • Creating approval workflows
  • Sending email and mobile notifications
  • Error Handling and Troubleshooting

Managing errors in flows

  • Debugging and troubleshooting techniques

DESKTOP FLOWS (RPA)

Introduction to Desktop Flows

  • Understanding Robotic Process Automation (RPA)
  • Setting up Power Automate Desktop

Building Desktop Flows

  • Recording desktop actions
  • Automating desktop applications

Advanced Desktop Flow Features

  • Using conditions and loops in desktop flows
  • Integrating with cloud flows

BUSINESS PROCESS FLOWS

Introduction to Business Process Flows

  • Understanding business process automation
  • Creating a simple business process flow

Customizing Business Process Flows

  • Defining stages and steps
  • Implementing business rules and logic

Advanced Business Process Flow Features

  • Using custom entities and fields
  • Integrating with Power Apps

PROJECTS

Power Automate Projects

  • Project 1: Automated Invoice Approval Workflow
  • Project 2: Employee Onboarding Automation
  • Project 3: Social Media Post Scheduler
  • Project 4: Customer Support Ticketing System
  • Project 5: Monthly Sales Report Automation

Desktop Flows (RPA)

  • Project 1: Automated Data Entry from Emails
  • Project 2: Invoice Processing and Archiving
  • Project 3: Automated Report Generation
  • Project 4: Customer Account Reconciliation
  • Project 5: Automated Data Migration

Python for Automation

System Requirements

System Requirements:

  1. Power BI Desktop

    Free & Downloadable from Microsoft Store App

    https://www.microsoft.com/store/productid/9NTXR16HNW1T?ocid=pdpshare

  2. Excel 2016 & above with PowerPivot

    Available with Office 365 subscriptions that include desktop versions of Excel for Windows.

  3. MS-SQL Server

    https://www.microsoft.com/en-in/sql-server/sql-server-downloads

    Kindly install Developer Edition as it is full-featured free edition, licensed for use as a development and test database in a non-production environment.

  4. SQL Server Management Studio (SSMS)

    Download and install SSMS from https://learn.microsoft.com/en-us/sql/ssms/download-sql-server-management-studio-ssms?view=sql-server-ver16

  5. Secondary Monitor (optional, but recommended)

    Having a secondary monitor will greatly assist in following the pace of the trainer. It allows you to view instructions and your own workspace simultaneously, enhancing your learning experience.

fullstack courses

Taught by Microsoft Certified Trainers

All our classes are live,
hands-on and with
real-trainers.

fullstack courses

Cloud-Powered Data Engineering & BI Projects

Real-time Projects (Practical Application)

Master the full data lifecycle—from ingestion to insight—with hands-on projects in Azure Data Factory, Databricks, Synapse Analytics, and Power BI. Build automated ETL pipelines, optimize real-time data processing, and drive AI-powered analytics. Gain practical, job-ready skills to architect scalable, cloud-based data solutions that power business intelligence and automation at an enterprise level.

fullstack courses Power BI

fullstack courses SQL

fullstack courses Data Factory & KQL Analytics

fullstack courses Fabric Lakehouse

fullstack courses Power Automate & Fabric Workflows

fullstack courses Python

fullstack courses Power Apps

Enterprise Sales Performance Dashboard

Develop an interactive Power BI dashboard to analyze regional and product-wise sales performance. Utilize DAX measures for YOY growth, sales variance, and customer segmentation, while Power Query is used to clean and transform raw sales data from multiple sources.

Customer Churn Prediction

Build a churn prediction model by integrating customer interaction data, support tickets, and transactional history. Use Power Query for data transformation and DAX measures to calculate churn probability based on behavioral patterns.

HR Analytics & Workforce Planning

Create an HR dashboard to track employee retention, hiring trends, and performance metrics. Connect multiple data sources to Power BI, apply DAX formulas to calculate attrition rates, and implement role-based security for restricted views.

Supply Chain & Inventory Optimization

Design a Power BI solution to monitor inventory levels, supplier performance, and stock movement across locations. Use Power Query to merge purchase order data with warehouse stock levels and apply DAX for predictive analytics on stock replenishment.

Financial Reporting & Budget vs. Actuals Analysis

Automate financial reporting using DAX calculations for variance analysis, custom KPIs, and trend forecasting. Apply Power Query transformations to consolidate financial statements from different departments into a unified report.

Database Design & Normalization

Design and normalize relational databases using primary keys,foreign keys, and normal forms to optimize storage and scalability.

Customer Data Analysis

Analyze customer data with JOINs, GROUP BY, and HAVING to identify trends, segment groups, and generate insights for marketing.

Sales Data Analysis

Use window functions and CTEs to track sales metrics, revenue, and product performance, generating actionable insights.

Inventory Management Queries

Leverage subqueries, UNION, and CASE to track inventory, product stock, and sales velocity for decision-making.

Employee Performance Tracker

Apply ranking functions (e.g., RANK(), DENSE_RANK()) to evaluate employee performance, track KPIs, and enhance workforce management.

Financial Reporting Queries

Retrieve financial data using aggregate functions and GROUP BY to automate real-time reports for balance sheets and P&L statements.

Sales Data ETL Pipeline

Build a data pipeline with Microsoft Fabric Data Factory to extract sales data from multiple sources (CRM, ERP systems), transform the data using KQL Analytics for cleaning and analysis, and load the data into a Power BI dataset.

Customer Segmentation Data Pipeline

Create an ETL pipeline that extracts customer data from various systems, cleanses it using KQL, and loads the data into a Lakehouse for further analysis. Use Power BI to visualize customer segments and their behavior.

Product Inventory Data Integration

Build a pipeline to integrate product inventory data from multiple sources, transforming and cleaning it using KQL and loading it into a Lakehouse. Create reports in Power BI to monitor inventory levels, sales trends, and restocking needs.

Marketing Data Aggregation Pipeline

Create an automated data pipeline that aggregates marketing campaign data from social media platforms, cleanses it with KQL, and loads it into a Lakehouse. Use Power BI to track campaign performance and ROI.

Financial Data Transformation Pipeline

Develop an ETL pipeline that transforms financial transaction data from multiple sources. Use KQL Analytics to clean and aggregate the data, then load it into a Lakehouse for analysis. Build a Power BI report to monitor financial health and trends.

Customer Data Lakehouse

Set up a Fabric Lakehouse to store and manage customer data from CRM, transactional systems, and support platforms. Use Delta Tables to ensure ACID transactions and track historical data. Analyze this data using KQL and visualize it with Power BI.

Sales Data Lakehouse

Build a Lakehouse to consolidate sales data from different sources and transform it using KQL. Utilize Delta Tables to manage incremental data updates and perform real-time analysis. Use Power BI to create a sales performance dashboard.

Inventory Management Lakehouse

Set up a Lakehouse for storing inventory data from multiple sources like warehouse management systems. Use KQL to clean, aggregate, and analyze data, and store transactional data in Delta Tables to track inventory changes over time. Visualize it using Power BI.

Marketing Data Lakehouse

Create a Lakehouse to store and analyze marketing campaign data. Use Delta Tables to track real-time updates and changes. Use KQL Analytics to perform customer segmentation and analyze marketing performance, with visualizations in Power BI.

Financial Data Lakehouse

Build a Lakehouse for storing and transforming financial transaction data from various sources, leveraging Delta Tables for ACID compliance and historical data tracking. Use KQL for querying and Power BI for detailed financial reporting.

Automated Sales Report Refresh

Create a Power Automate workflow that automatically refreshes Power BI sales dashboards every time new data is loaded into the Lakehouse or when an update is detected in the Delta Tables. Set notifications for stakeholders when the reports are ready.

Customer Data Sync Workflow

Build a workflow using Power Automate to automatically synchronize customer data between the CRM and the Lakehouse. Trigger data updates and refresh reports in Power BI when new customer information is added or updated.

Automated Marketing Performance Updates

Create a Power Automate workflow to refresh marketing performance reports in Power BI every time new marketing data is loaded into the Lakehouse. Automate the email notifications to stakeholders when updates are completed.

Order Processing & Dataflow Automation

Use Power Automate to automate the processing of sales orders, integrating data from order management systems into the Lakehouse. Automatically trigger data transformation and updates via Dataflows Gen2, and refresh Power BI reports.

Data Pipeline Failure Alerting Workflow

Build a Power Automate workflow that monitors Data Factory pipeline runs. If a pipeline fails, automatically send an alert email or create a task in a project management system. Integrate this with Power BI to track pipeline performance.

Data Cleansing Pipeline for Lakehouse

Use Python (via Notebooks in Fabric) to clean, deduplicate, and normalize raw CSV/parquet files before storing them in Delta format in the Fabric Lakehouse. Integrate with a Data Factory pipeline for scheduled ingestion.

Automated Data Quality Checks on Delta Tables

Build a reusable Python script to perform column-level validation (null checks, data types, range thresholds) on Delta tables in the Lakehouse. Automatically log failures to a monitoring table and trigger alerts.

Generate KPI Summary Tables for Power BI

Write a Python routine to compute summary KPIs (e.g., weekly sales, customer retention, churn rates) and store results in a Gold layer table. These output tables are optimized for reporting in Power BI dashboards.

Notebook-Driven ETL for Semi-Structured Data

Automate ETL for JSON or nested data (e.g., API exports, logs) using Python in a Fabric Notebook. Transform and flatten the data structure, then write the result into Delta tables for KQL/Power BI consumption.

Automated Archival and Partition Management

Use Python to periodically move older data partitions to cold storage and maintain optimized table size for querying. This improves performance and cost-efficiency within the Lakehouse.

Employee Leave Request App

Design a user-friendly app for employees to submit leave requests. Automate approval workflows, track balances, and integrate with SQL databases for real-time leave management.

Sales Order Management App

Build an interactive app for sales teams to create, update, and track orders. Integrate with SQL to retrieve customer data and Power Automate to generate invoices and email confirmations.

Helpdesk System

Develop a mobile-friendly app where customers can log support tickets. Use Power Automate to assign cases, send updates, and generate Power BI reports for service performance tracking.

Expense Reimbursement Tracker

Create an app for employees to submit expense claims with receipt uploads. Automate approval workflows, validate entries against company policies, and generate real-time reimbursement status updates.

Inventory & Asset Management App

Design a system to track inventory and company assets, with barcode scanning capabilities. Connect to a SQL database for real-time stock updates and automate notifications for low inventory levels.

Develop an interactive Power BI dashboard to analyze regional and product-wise sales performance. Utilize DAX measures for YOY growth, sales variance, and customer segmentation, while Power Query is used to clean and transform raw sales data from multiple sources.

Build a churn prediction model by integrating customer interaction data, support tickets, and transactional history. Use Power Query for data transformation and DAX measures to calculate churn probability based on behavioral patterns.

Create an HR dashboard to track employee retention, hiring trends, and performance metrics. Connect multiple data sources to Power BI, apply DAX formulas to calculate attrition rates, and implement role-based security for restricted views.

Design a Power BI solution to monitor inventory levels, supplier performance, and stock movement across locations. Use Power Query to merge purchase order data with warehouse stock levels and apply DAX for predictive analytics on stock replenishment.

Automate financial reporting using DAX calculations for variance analysis, custom KPIs, and trend forecasting. Apply Power Query transformations to consolidate financial statements from different departments into a unified report.

Design and normalize relational databases using primary keys, foreign keys, and normal forms to optimize storage and scalability.

Analyze customer data with JOINs, GROUP BY, and HAVING to identify trends, segment groups, and generate insights for marketing.

Use window functions and CTEs to track sales metrics, revenue, and product performance, generating actionable insights.

Leverage subqueries, UNION, and CASE to track inventory, product stock, and sales velocity for decision-making.

Apply ranking functions (e.g., RANK(), DENSE_RANK()) to evaluate employee performance, track KPIs, and enhance workforce management.

Retrieve financial data using aggregate functions and GROUP BY to automate real-time reports for balance sheets and P&L statements.

Build a data pipeline with Microsoft Fabric Data Factory to extract sales data from multiple sources (CRM, ERP systems), transform the data using KQL Analytics for cleaning and analysis, and load the data into a Power BI dataset.

Create an ETL pipeline that extracts customer data from various systems, cleanses it using KQL, and loads the data into a Lakehouse for further analysis. Use Power BI to visualize customer segments and their behavior.

Build a pipeline to integrate product inventory data from multiple sources, transforming and cleaning it using KQL and loading it into a Lakehouse. Create reports in Power BI to monitor inventory levels, sales trends, and restocking needs.

Create an automated data pipeline that aggregates marketing campaign data from social media platforms, cleanses it with KQL, and loads it into a Lakehouse. Use Power BI to track campaign performance and ROI.

Develop an ETL pipeline that transforms financial transaction data from multiple sources. Use KQL Analytics to clean and aggregate the data, then load it into a Lakehouse for analysis. Build a Power BI report to monitor financial health and trends.

Set up a Fabric Lakehouse to store and manage customer data from CRM, transactional systems, and support platforms. Use Delta Tables to ensure ACID transactions and track historical data. Analyze this data using KQL and visualize it with Power BI.

Build a Lakehouse to consolidate sales data from different sources and transform it using KQL. Utilize Delta Tables to manage incremental data updates and perform real-time analysis. Use Power BI to create a sales performance dashboard.

Set up a Lakehouse for storing inventory data from multiple sources like warehouse management systems. Use KQL to clean, aggregate, and analyze data, and store transactional data in Delta Tables to track inventory changes over time. Visualize it using Power BI.

Create a Lakehouse to store and analyze marketing campaign data. Use Delta Tables to track real-time updates and changes. Use KQL Analytics to perform customer segmentation and analyze marketing performance, with visualizations in Power BI.

Build a Lakehouse for storing and transforming financial transaction data from various sources, leveraging Delta Tables for ACID compliance and historical data tracking. Use KQL for querying and Power BI for detailed financial reporting.

Create a Power Automate workflow that automatically refreshes Power BI sales dashboards every time new data is loaded into the Lakehouse or when an update is detected in the Delta Tables. Set notifications for stakeholders when the reports are ready.

Build a workflow using Power Automate to automatically synchronize customer data between the CRM and the Lakehouse. Trigger data updates and refresh reports in Power BI when new customer information is added or updated.

Create a Power Automate workflow to refresh marketing performance reports in Power BI every time new marketing data is loaded into the Lakehouse. Automate the email notifications to stakeholders when updates are completed.

Use Power Automate to automate the processing of sales orders, integrating data from order management systems into the Lakehouse. Automatically trigger data transformation and updates via Dataflows Gen2, and refresh Power BI reports.

Build a Power Automate workflow that monitors Data Factory pipeline runs. If a pipeline fails, automatically send an alert email or create a task in a project management system. Integrate this with Power BI to track pipeline performance.

Use Python (via Notebooks in Fabric) to clean, deduplicate, and normalize raw CSV/parquet files before storing them in Delta format in the Fabric Lakehouse. Integrate with a Data Factory pipeline for scheduled ingestion.

Build a reusable Python script to perform column-level validation (null checks, data types, range thresholds) on Delta tables in the Lakehouse. Automatically log failures to a monitoring table and trigger alerts.

Write a Python routine to compute summary KPIs (e.g., weekly sales, customer retention, churn rates) and store results in a Gold layer table. These output tables are optimized for reporting in Power BI dashboards.

Automate ETL for JSON or nested data (e.g., API exports, logs) using Python in a Fabric Notebook. Transform and flatten the data structure, then write the result into Delta tables for KQL/Power BI consumption.

Use Python to periodically move older data partitions to cold storage and maintain optimized table size for querying. This improves performance and cost-efficiency within the Lakehouse.

Design a user-friendly app for employees to submit leave requests. Automate approval workflows, track balances, and integrate with SQL databases for real-time leave management.

Build an interactive app for sales teams to create, update, and track orders. Integrate with SQL to retrieve customer data and Power Automate to generate invoices and email confirmations.

Develop a mobile-friendly app where customers can log support tickets. Use Power Automate to assign cases, send updates, and generate Power BI reports for service performance tracking.

Create an app for employees to submit expense claims with receipt uploads. Automate approval workflows, validate entries against company policies, and generate real-time reimbursement status updates.

Design a system to track inventory and company assets, with barcode scanning capabilities. Connect to a SQL database for real-time stock updates and automate notifications for low inventory levels.

Gain industry-recognized credentials.

7 Specialized Certificates

Shareable certificate

Add to your LinkedIn profile

Gain industry-recognized credentials.

7 Specialized Certificates

Training Schedule

Week 1

Quick Excel Brush-up & Power BI

Tue, Apr 11 to Fri, Apr 14   |   11:00 AM to 1:00 PM ET

Week 2

DAX Function & Power Query

Mon, Apr 17 to Fri, Apr 21   |   11:00 AM to 1:00 PM ET

Week 3

Power Pivot, T-SQL & Power BI Administration

Mon, Apr 24 to Thu, Apr 27   |   11:00 AM to 1:00 PM ET

Week 4

Advanced DAX Function & M-Programming

Mon, Apr 17 to Fri, Apr 21   |   11:00 AM to 1:00 PM ET

Week 5

Ad-hoc Automations using VBA Macro

Mon, Apr 24 to Thu, Apr 27   |   11:00 AM to 1:00 PM ET

Week 6

ETL with MS-SQL & SSIS and Architect BI Solution

Mon, Apr 24 to Thu, Apr 27   |   11:00 AM to 1:00 PM ET

Limited Seats. Registration Closing Soon

Have Questions?

Tel:

+1 650 491 3131

Email:

support@excelgoodies.com

Projects & Assignments

What's included?

  • 74 hours of live instructor-led training
  • 8 SQL & KQL Querying Projects
  • 6 Power BI & Advanced DAX Projects
  • 4 Dataflows Gen2 & Power Query Projects
  • 5 Data Factory & Lakehouse ETL Projects
  • 4 Lakehouse & Delta Table Management Projects
  • 3 Power Automate & Fabric Workflow Projects
  • 3 Power Apps Projects
  • 2 Master Projects integrating Power BI, Lakehouse, SQL & Automation
  • Data Engineering & BI: Fabric Expert Certificate
  • 30-day post-training support

Upcoming Cohort

Starts On

Time

Course Fee

$2999

FAQs

If you're working in data engineering, Microsoft Fabric is quickly becoming a game-changer. It combines all the tools you need for data integration, real-time analytics, and automation in one platform. It helps you build, manage, and scale data workflows more easily and efficiently. By mastering Fabric, you'll not only keep up with industry trends but also boost your career by gaining expertise in a tool that companies are increasingly adopting. Plus, it’ll help you stand out in your role and take on more impactful, high-level projects.

While a basic understanding of data concepts or experience in a related field is helpful, this course is designed to be accessible to professionals at various experience levels. Whether you’re new to data engineering or looking to upskill, you’ll gain valuable expertise throughout the course.

Yes, Microsoft Fabric is a paid service, typically available through a subscription model. Microsoft provides various pricing tiers depending on your organization’s size and requirements. However, there are also free trials available for learning and exploration purposes. The subscription often includes additional features and enhanced support, which makes it suitable for enterprise-scale operations.

  • Operating System – Windows 10 or later (Mac users will need a Windows VM)
  • RAM – Minimum 8GB (Recommended: 16GB for large datasets)
  • Power BI Desktop – Free version Download here
  • Azure Subscription – Free-tier available for practice Sign up here
  • SQL Server Express – Free version Download here
  • Python – Install the latest version Download here
  • Power Automate & Power Apps – Requires a Microsoft 365 account

Yes! We provide corporate invoices for employer-sponsored payments. You can either use a company card or request an invoice to forward to your finance team.

These options are available on the

Yes! We offer discounts for teams of 10 or more enrolling together. Customized corporate training is also available.

Contact us for group pricing.

We accept credit/debit cards, wire transfers, and corporate invoices for employer-sponsored payments.

After completing this course, you'll be qualified for roles such as:

  • Data Engineer
  • Cloud BI Engineer
  • Data Architect
  • Data Solutions Architect
  • Business Intelligence Analyst
  • Cloud Data Analyst
  • AI & Data Automation Engineer

These roles are in high demand across industries like technology, finance, healthcare, and e-commerce, with many companies adopting Microsoft Fabric for their data solutions.

Over 25,000 organizations, including 67% of Fortune 500 companies, are already using Microsoft Fabric to power their data operations. This reflects its growing importance in the industry, with businesses leveraging Fabric’s suite to streamline data workflows and enable AI-driven insights.

If you're a Data Analyst, Data Engineer, or BI Developer, you can immediately start applying Fabric’s data integration, pipeline management, and visualization tools to automate reporting, optimize cloud workflows, and streamline data modeling. You can enhance data collaboration across teams, and use real-time analytics for better decision-making.

Yes! This course covers practical, hands-on projects that replicate real-world data engineering tasks. You'll learn how to design end-to-end data pipelines, automate cloud workflows, optimize data ingestion, and manage cloud-based data solutions—all using the latest tools and technologies within the Microsoft Fabric ecosystem.

Yes. You’ll receive a total of 7 certificates—one for each major tool covered during the program, and a master certificate titled “Data Engineering & BI: Fabric Expert” upon completing the full course. These certificates validate your hands-on expertise across the Microsoft Fabric ecosystem and enhance your professional credibility in cloud data engineering and BI automation.

This is a live, instructor-led course with hands-on exercises, real-world case studies, and Q&A discussions to ensure a highly engaging learning experience.

No, this is a live interactive course with hands-on projects. However, you’ll receive detailed assignments, documentation, and automation templates to practice.

If you miss a session, we provide class notes and exercises to help you catch up. Additionally, you can attend the same session in a future batch (subject to availability).

You can retake sessions from a future batch (subject to availability), but full course re-enrollment may require an additional fee.

Unlike pre-recorded courses, this is a live, interactive program where you work on real-world datasets and get direct access to expert instructors for personalized guidance.

More questions ?

Build Real-World Solutions During the Course

Key Skills You'll Master

End-to-End Data Pipelines

Cloud Data Integration

Real-Time Processing

Data Modeling & Transformation

Lakehouse & Delta Table Management

Data Visualization

Cloud Workflow Automation

ETL Optimization

AI-Driven Automation

Data Governance & Security

Cloud Analytics Collaboration

Scalable Solution Design

skills to master

About The Trainer

Mr. Sami

MCT, MCP, MEE, MOS

30,000+

Students Trained

18+

Year of Experience

4.9

Reviews

Mr. Sami is an exceptionally accomplished and certified Microsoft Trainer, possessing extensive expertise in the fields of Finance, HR, and Information Technology. With an impressive 14-year tenure in the industry, he has successfully trained and empowered over 23,000 professionals, and the number continues to grow.

He has undertaken assignments with the renowned IRS, The World Bank, Tata Chemicals, Buckman Laboratories, Standard Chartered, ING Barings and much more. His nature of going that Extra Mile has got him the startling popularity amongst the Excelgoodies prominent clients.

Build Real-World Solutions During the Course

Eg difference The Excelgoodies Difference

We Spot Trends Before They Become Industry Standards

The analytics industry moves fast. We move faster. We constantly update our courses to match the latest industry needs, so you’re always learning what’s in demand—before everyone else.

01
02

Learn What Matters, Not Just What’s Trending

BI & Analytics isn’t about knowing one tool—it’s about knowing how to use the right tools together. Our courses don’t just teach software; they teach end-to-end reporting, automation, and cloud-driven analytics workflows—exactly what businesses need.

Tech-Enabled Learning,
Zero Hassles

Forget scattered emails and outdated PDFs. Our AI-powered student portal keeps everything in one place—live classes, assignments, progress tracking, instructor feedback, invoices, and instant support—so you stay focused on learning.

03
04

Real Projects, Real Experience, Real Confidence

No more theory-only learning—you’ll walk out of our courses with proven expertise in the tools and techniques hiring managers want.

Corporate Training

bi_report_automation_mob

Avail additional 10% Corporate Benefit on the total course fee for 5+participants.

Get you team BI ready, today.

Mr. Perrie Smith

Business Associate

Prove you're human: Type the code shown.

=
Excelgoodies

By clicking any of the above buttons, I agree to the terms & conditions and privacy policy, and I consent to receive updates via SMS or email

Esteemed Clientele

Esteemed Clientele Esteemed Clientele Esteemed Clientele Esteemed Clientele Esteemed Clientele Esteemed Clientele Esteemed Clientele Esteemed Clientele Esteemed Clientele Esteemed Clientele Esteemed Clientele Esteemed Clientele Esteemed Clientele Esteemed Clientele Esteemed Clientele Esteemed Clientele Esteemed Clientele Esteemed Clientele Esteemed Clientele Esteemed Clientele Esteemed Clientele Esteemed Clientele Esteemed Clientele Esteemed Clientele Esteemed Clientele Esteemed Clientele Esteemed Clientele Esteemed Clientele Esteemed Clientele Esteemed Clientele Esteemed Clientele Esteemed Clientele Esteemed Clientele Esteemed Clientele Esteemed Clientele Esteemed Clientele

Why people choose Excelgoodies for their career

Total Reviews 2080k
Average Rating
4.5
Excelgoodies Excelgoodies Excelgoodies Excelgoodies Excelgoodies
fullstack courses

Learner stories
around the world

Industry Insights

Alternate Text

FSBI

Why does FSBI Specialist earns 30%-50% more than BI experts?

Alternate Text

FSBI

Exploring the Different Roles and Career Paths in FSBI &
Automation

Alternate Text

FSBI

Real-World Business Scenario: PwC Case Study – From Weeks
to hours

Industry Insights

APPLICATION DEADLINE

Registration Closes
on .

Prove you're human: Type the code shown.

=
Excelgoodies

By clicking any of the above buttons, I agree to the terms & conditions and privacy policy, and I consent to receive updates via SMS or email