Excelgoodies +1 650 491 3131

Batch starts on

th

Early Bird Course Fee

Early Bird Course Fee

$1999
$1699*

Full Stack BI


Reporting
& Automation Course

Power BI | DAX | MS-SQL | ETL with SSIS | VBA | SSAS

Power BI | DAX | MS-SQL | ETL | VBA | SSAS

All-in-One Course | View Schedule

MASTER

Data Analytics, Advanced Reporting,
Programming & Automation.

end-to-end power reporting.

Full Stack BI Reporting & Automation

75-hour Course | 6 Data-Tools | 9 Specialist Certificates

Power BI | DAX | MS-SQL | ETL | VBA | Python

(1.5K+ Professionals enrolled)

All-in-One Course | View Schedule

Power BI

Adv. DAX

MS-SQL

ETL with SSIS

VBA

SSAS

Master data analytics, advanced BI reporting, and automation like a boss, and become a bonafide techno-functional pro. Level up your analytical skills and dominate the data game with our end-to-end BI Reporting program.

Prove you're human: Type the code shown.

=
ExceGoodies

Program at a Glance

TOTAL COURSE DURATION

75-hours, 30 Sessions

Online live classes, Instructor-led.

TRAINING SHEDULE

View Schedule

POWER BI, SQL, ETL & SSAS

45+ Projects

CERTIFICATES

9-Specialist Certificates (one for each tool)

Tools You'll Learn

Visualization Tool

Microsoft Power BI

Data Modeling Tool

Power Pivot & SSAS

Data Integrator Tool

ETL with SSIS

Data Transformation Tool

Power Query

Data Warehousing Tool

MS-SQL

Automation Tool

VBA

Course Content Overview

A snapshot of what you'll be learning in 6-weeks.

Objective: To prepare a quick POC with small data and get the concurrence on the output before investing time on huge datasets.

Overview

  • Core Fundamentals Of Spreadsheets
  • How System Interprets Your Data
  • Crucial Formatting Concepts
  • Understanding Core Formula Fundamentals & Advanced Referencing Concepts
  • 60+ Advanced Excel Functions
  • Cleansing & Transforming Data
  • Data Summarization
  • Conditional Summarization
  • Working With Multiple Datasets
  • Working With Pivot Tables Including Advanced Pivot Tables Options
  • 15+ Charts - When To Use What Chart?
  • Develop Data Models to Simulate Complex Business Scenarios for What IF Analysis

Objective: To do faster queries, simpler DAX code and enjoy easier maintenance.

Introduction To PowerPivot

  • Limitation Of Excel Functions
  • Limitation Of Excel Pivot table
  • Why Powerpivot?
  • Powerpivot Features – Overview

Powerpivot Environment

  • Opening Powerpivot Environment
  • Understanding External Data Section
  • Understanding Formatting
  • Powerpivot Views
  • Understanding Measures

Loading Data Into PowerPivot

Calculated Columns

  • Calculated Columns
  • Entering Formulas
  • Using Autocomplete Feature
  • Renaming Columns
  • Understanding Tables

Creating Measures

  • Creating Simple DAX Measures
  • Explicit Measure Vs Implicit Measure
  • Referencing Measures In Other Measures
  • Formatting Measures
  • Manage Data Relationships
  • Working With Multiple Tables
  • Disconnected Tables
  • Creating Custom Calendars
  • Using Advanced Filter()
  • Advanced Calculated Columns
  • Understanding Relationship Concept
  • Join Tables
  • Left Join Tables
  • Right Join Tables

Data Visualization Using

  • Charts, Score Cards And Dashboards
  • Slicers
  • Map Visualizations
  • Data Binding And Formatting

Creating Advanced Dashboards With PowerPivot

Creating Free Form Reports With PowerPivot & Excel

Develop Simple Models And Forecast Data Using PowerPivot & Excel

Objective: Getting started with Power BI and leverage it’s full potential to develop compelling visualizations.

Building Blocks of Power BI

  • Visualizations
  • Datasets
  • Reports
  • Dashboards
  • Tiles

Building Your First Power BI Report

  • Connect to Data Sources in Power BI Desktop
  • Clean and Transform Your Data With the Query Editor
  • Create a report in Power BI Desktop
  • Publish the report in the Power BI service

Data Modeling with Power BI

  • Fundamentals of Modeling
  • How to Manage Your Data Relationships
  • Create Calculated Columns
  • Optimizing Data Models for Better Visuals
  • Create measures and work with time-based functions
  • Create Calculated Tables
  • Explore Time-Based Data

Visualizations

  • Create and Customize Simple Visualizations

Building compelling data visualizations

  • Identify metrics and pair them with appropriate data visuals
  • Using slicers
  • Creating Map Visualizations
  • Creating Tables and Matrixes
  • Creating Scatter Charts
  • Creating Waterfall and Funnel Charts
  • Using Gauges and Single Number Cards
  • Charting Options including Formatting with Colors, Shapes, Text Boxes, Images, etc.

Designing User-friendly reports

  • Customize themes
  • Create versatile layouts for your reports
  • Design principles to reduce noise and highlight data stories

Creating interactive reports for data exploration

  • Filtering & drilling for insights
  • Difference between filters & slicers
  • Filter pane for reporting needs

Exploring Data

  • Use Quick Insights in the Power BI service
  • Create and Configure A Dashboard
  • Share Dashboards with your organization
  • Display Visuals and Tiles Full-Screen 

Objective: To learn different methods to Transform Data before uploading it to the SQL Database.

Overview

  • Introduction
  • Loading & Refresh
  • Combine data from multiple data sources

Data Transformation

  • Editing Queries Created with Power Query
  • Editing Column Headers in Power Query
  • Splitting Column Data with Power Query
  • Sorting Data
  • Multi-Level Sorting
  • Filtering Data
  • Aggregate data from a column
  • Insert a custom column into a table
  • Merge columns
  • Remove columns
  • Remove rows with errors
  • Promote a row to column headers
  • Transforming Text Values
  • Replacing Data
  • Using the Fill command
  • Pivot and Unpivot Column
  • Transpose Query Data
  • Pivot Column Command in Action
  • Unpivot Columns Command
  • Grouping Data
  • Create a Duplicate Query
  • Group and Summarize Data
  • Advanced Data Grouping
  • Working with multiple sources in Power Query
  • Multiple Excel Tables
  • Expand a column containing an associated table
  • Understanding Table Relationships
  • Merging Queries

Loading Power Query Data to Destinations

  • Familiarity with the Load & Refresh Settings
  • Loading it to Workbook
  • Loading it to Data Model

Objective: To add analytical power to your Power BI model that is not available in the data as-is, using DAX.

Overview

  • What is DAX?
  • Data Types
  • Table-Valued Functions
  • Building a Calendar Table
  • Date and Time Functions
  • Filter Functions
  • Information Functions
  • Logical Functions
  • Mathematical and Trigonometric Functions
  • Statistical Functions
  • Text Functions
  • Time Intelligence Functions

Creating Advanced Dax Measures With Advanced Dax Functions

  • Calculate()
  • All()
  • Filter()
  • IF()
  • Switch()
  • SumX()

Evaluation Context

  • Filter Context
  • Row Context
  • Using RELATED in a Row Context
  • Filters and Relationships
  • USERELATIONSHIP

Hierarchies in DAX

Querying with DAX

Relationships

  • One-to-Many Relationships
  • Many-to-Many Relationships

Objective: To query MS-SQL Database (es) by writing accurate, effective, and robust T-SQL code - the right way.

Introduction to MS-SQL

  • Creating a Database
  • Understanding Tables and Creating Tables
  • Inserting, Updating and Deleting Data
  • Querying Data
  • Filtering Data
  • Grouping Data
  • Ordering Data
  • Column Aliases
  • Table Aliases

DDL INSIGHTS

  • CREATE TABLE
  • Dropping Objects
  • CREATE INDEX
  • TEMPORARY OBJECTS
  • Object Naming and Dependencies

SELECT STATEMENTS

  • Simple SELECTs
  • Calculated and Derived Fields
  • SELECT TOP / BOTTOM Records
  • Derived Tables
  • Joins
  • Predicates
  • Subqueries
  • Aggregate Functions
  • GROUP BY and HAVING
  • UNION
  • ORDER BY

Objective: Leverage DAX potential to perform advanced data analytics

Advanced Table Manipulation Functions

  • ADDCOLUMNS
  • CROSSJOIN
  • DATATABLE
  • DISTINCT column
  • EXCEPT
  • FILTERS
  • GENERATESERIES
  • INTERSECT
  • NATURALINNERJOIN
  • NATURALLEFTOUTERJOIN
  • ROW
  • SELECTCOLUMNS
  • SUMMARIZE
  • SUMMARIZECOLUMNS
  • Constructor
  • TOPN
  • UNION
  • VALUES

Advanced Filter Functions

  • ADDMISSINGITEMS
  • ALL
  • ALLCROSSFILTERED
  • ALLEXCEPT
  • ALLSELECTED
  • CALCULATE
  • DISTINCT
  • FILTER
  • FILTERS
  • RELATED
  • REMOVEFILTERS
  • SELECTEDVALUE
  • USERELATIONSHIP
  • VALUES

ADVANCED USAGE OF

  • CALCULATE
  • SUMX
  • COUNTX
  • AVERAGEX
  • MAXX
  • MINXX
  • DATATABLE

Objective: To perform advanced and complex data transformations not available in the Query Editor

Understanding M Programming Code

  • M LANGUAGE Specifications
  • Lexical Structure
  • Basic Concepts
  • Values
  • Types
  • Operators
  • Let
  • Conditionals
  • Functions
  • Error Handling
  • Creating Simple M Expressions
  • Creating Simple M Functions
  • Working with List, Record & Tables
  • Understanding Operators and Evaluation Methods
  • Data Types & Type Conversions

Working with M Functions

  • ACCESSING DATA FUNCTIONS - From Excel, SQL, CSV, Tab-Delimited, Webpage, XML, JSON, SharePoint, etc.
  • COMBINER FUNCTIONS
  • COMPARER FUNCTIONS
  • DATE FUNCTIONS
  • DATETIME FUNCTIONS
  • DURATION FUNCTIONS
  • LIST FUNCTIONS
  • LOGICAL FUNCTIONS
  • NUMBER FUNCTIONS
  • RECORD FUNCTIONS
  • REPLACER FUNCTIONS
  • SPLITTER FUNCTIONS
  • TABLE FUNCTIONS
  • TEXT FUNCTIONS
  • TIME FUNCTIONS
  • TYPE FUNCTIONS
  • VALUE FUNCTIONS

Objective: Get hands-on experience with advanced administration settings, permissions, Data refresh times etc.

Overview

  • Publishing Power BI Reports
  • Creating & Managing Workspaces and Its Access
  • Creating & Managing Dashboard and Its Access
  • Installing & Configuring Data gateway
  • Scheduling and configuring data refresh
  • Managing & Reusing Datasets
  • Scheduling Report Alerts
  • Setting up Row Level Permissions
  • Managing Users & Audit Log
  • Custom Branding Power BI For your Organization
  • Adding Custom Visuals for your Organization

Objective: To collect data from multiple ad-hoc sources and prepare it for loading it to SQL Database for BI Reporting purpose.

Overview

  • Core Fundamentals of VBA
  • Understanding VBA Environment
  • Writing simple VBA Codes
  • Concept of Variables & Data Types
  • Testing & Debugging Code
  • Understanding Fundamental Coding Blocks
  • IF Block
  • Select Case
  • And / Or Conditions
  • Understanding Fundamentals of Looping
  • For Loop
  • Do While
  • Understanding Object Based Programming
  • Advanced Excel Automations
  • Word Automation
  • Outlook Automation
  • Working with Database
  • Working with Web Browsers - Web Scrapping
  • Creating User Interfaces with VB Forms
  • Handling Run Time Errors & Securing Code

Objective: Extract Data from multiple data sources, transform them with SSIS or M-Program transformation options and, Load it to Reporting Database / Data Warehouse

Understanding SSIS Packages

Creating & Managing Connections with Connection Manager

  • Importing Data With ADO.NET
  • Importing Data From Excel
  • Importing Data From Flat Files
  • Importing Data From FTP
  • Importing Data From SMTP
  • Working with Multiple Connections
  • Working with Control Flows
  • Working with Data Flows
  • Working with Variables & Expressions

Performing Transformations

  • Aggregation Transformations
  • Audit Transformations
  • Conditional Split Transformations
  • Data Conversion Transformations
  • DQS Cleansing Transformations
  • Derived Columns Transformations
  • Export Column Transformation
  • Fuzzy Grouping Transformation
  • Fuzzy Lookup Transformation
  • Lookup Transformation
  • Merge Transformation
  • Merge Join Transformation
  • Pivot Transformation
  • Unpivot Transformation
  • Row Count Transformation
  • Sort Transformation

Loading Data to SQL Server

Advanced SQL Concepts

DML INSIGHTS

  • INSERT
  • UPDATE
  • DELETE
  • Detecting DML Errors

Understanding Data Types

  • Dates
  • Strings
  • Numeric
  • BLOBs
  • Bits
  • UNIQUEIDENTIFIER
  • Cursor Variables
  • Timestamps

DDL INSIGHTS

  • CREATE TABLE
  • Dropping Objects
  • CREATE INDEX
  • TEMPORARY OBJECTS
  • Object Naming and Dependencies

SQL VIEWS

  • Create & Manage VIEWs
  • Getting a VIEW's Source Code
  • Updatable VIEWs
  • Derived Tables
  • Dynamic VIEWs
  • Partitioning Data Using Views
  • View Restrictions

Stored Procedures

  • Stored Procedure Advantages
  • Internals
  • Creating Stored Procedures, Executing Stored Procedures
  • Environmental Concerns
  • Parameters for Procedures
  • Important Automatic Variables
  • Flow Control Language
  • Errors
  • Nesting
  • AutoStart Procedures
  • User Defined Functions
  • Scalar UDFs
  • Table-Valued UDFs
  • Per-Row UDFs

Working with Date & Time

  • Date and Time Data Types
  • Date and Time Manipulation
  • Date and Time Functions
  • Literals
  • Identifying Weekday
  • Handling Date-only or Time-only Data Prior to SQL Server 2008
  • Examples of Date and Time Calculations
  • Rounding Issues
  • Date- and Time-Related Querying Problems
  • Age Problems
  • Overlaps
  • Grouping by the Week
  • Working Days
  • Generating a Series of Dates

SETS

  • Unions
  • Differences
  • Intersections
  • Subsets

Transactions

  • Transactions Defined
  • How SQL Server Transactions Work
  • Types of Transactions
  • Avoiding Transactions Altogether
  • Automatic Transaction Management
  • Transaction Isolation Levels
  • Transaction Commands and Syntax
  • Debugging Transactions
  • Optimizing Transactional Code

Objective: Developing expertise in SSAS Tabular for creating high-performance data models vital for real-time analysis and integrated BI reporting solutions.

SSAS Tabular Modeling - Introduction

  • Understanding SSAS
  • Installing and configuring a development environment
  • Installing Visual Studio
  • Configuring Tabular Mode Environment
  • Importing sample datasets
  • Configuring a workspace server
  • SSAS project properties

Creating & Working with Simple SSAS Tabular Models

  • Adding data into tabular models
  • Creating Calculated Columns
  • Creating Simple Measures
  • Creating Calculated Tables
  • Creating Calendar Tables
  • Creating and Working with Hierarchies
  • Working with Model Views
  • Working in Tabular Models & KPIs
  • Setting Relationships
  • Creating and deploying Simple Model
  • Use the models via SSMS, Excel & Power BI

Administering SSAS Tabular Models

  • Working with tabular model properties
  • Creating and working with partitions
  • Working with Roles
  • Server Properties
  • Managing SSAS Memory

SSAS Tabular Model - Security

  • Understanding Tabular Models Security
  • Set up row-level security
  • Set up dynamic filter security

Working with DAX Functions in SSAS Tabular Models

  • Creating Measures
  • Creating Calculates Columns
  • Using the Power BI DAX functions learnt in SSAS Tabular
  • Working with Calendar Tables
  • Date & Time Intelligence Functions

Connecting & Working with SSAS Tabular Models in Power BI

Objective: To put our entire learning to use and arrive at the best possible BI solution -using the right combination of available technologies.

Overview

  • Case Study 1
  • Case Study 2
  • Case Study 3
  1. Power BI Desktop

    Free & Downloadable from Microsoft Store App

    https://www.microsoft.com/store/productid/9NTXR16HNW1T?ocid=pdpshare

  2. Excel 2016 & above with PowerPivot

    Available with Office 365 subscriptions that include desktop versions of Excel for Windows.

  3. MS-SQL Server

    https://www.microsoft.com/en-in/sql-server/sql-server-downloads

    Kindly install Developer Edition as it is full-featured free edition, licensed for use as a development and test database in a non-production environment.

  4. SQL Server Management Studio (SSMS)

    Download and install SSMS from https://learn.microsoft.com/en-us/sql/ssms/download-sql-server-management-studio-ssms?view=sql-server-ver16

Program Overview

Total Course Duration

75-hours, 30 Sessions

Online live classes, Instructor-led.

Training Schedule

Power BI, SQL, ETL & SSAS

45+ Projects

One for each tool

9 Specialist Certificates

Tools You'll Learn

Visualization Tool

Microsoft Power BI

Data Modeling Tool

Power Pivot & SSAS

Data Integrator Tool

ETL with SSIS

Data Transformation Tool

Power Query

Data Warehousing Tool

MS-SQL

Automation Tool

VBA

Course Syllabus Overview

Quick brush-up with Excel

Excel is to BI what wireframing is to application development. Brush up your Excel skills with 60+ formulas, pivots, charts & dashboards to quickly build a POC with small data before investing your time in building complex BI reports with big datasets.

Why should I learn Excel?

Visualization with Power BI

Getting started with Power BI is simple. Then, once you want to leverage its full potential, you need a different set of skills. Learn how to develop these skills, unlock more insights through better data analysis and visualization with this section.

Why should I learn Power BI?

Advanced Calculation with DAX

Add analytical power to your Power BI model that is not available in the data as-is, using DAX. The goal of this section is to teach you basic to advance features of DAX, providing the knowledge to write formulas for common and advanced business scenarios.

Why should I learn DAX?

M-Programming with Power Query

During this section, you'll learn how to perform advanced data transformations not available in the Query Editor. We will discuss how to leverage the embedded PowerBI programming language (M) to achieve this.

Why Should I learn M-Programming?

Model-building with Power Pivot

Explore the most powerful tool to build data models, forecast estimates, perform what-if-analysis scenario etc. If you are yet to have the Power BI license, you would still be able to create powerful & blended reports and share it internally using Power Pivot.

Why should I learn Power Pivot?

ETL with SSIS

Extract - Transform - Load. Extract Data from multiple data sources, transform it with SSIS inbuilt transformation options or use M-Programs with SSIS and, Load it to the Reporting Database or Data Warehouse for generating dynamic BI Reports.

Why should I know ETL with SSIS?

Data warehousing using MS-SQL

Data for Power BI can come from many sources, but often the data is hosted in SQL Server. This section will teach you how to write accurate, effective, and robust T-SQL code- the right way and also understand the logic behind the same.

Why should I learn MS-SQL?

Modeling & Analytics with SSAS

In this section, you'll master SSAS Tabular, crafting optimized data models for lightning-fast analysis. You'll seamlessly integrate these models with BI tools, enabling real-time insights and building robust reporting solutions.

Why should I learn SSAS Tabular?

Architect Power BI Solution

This section will help you put together Excel, VBA, Power BI, DAX, Power Query and SQL to architect the best BI solution. You'll also learn to publish, securely share reports including row level permissions along with BI administrative tasks like setting up data gateways etc.

Why should I learn to Architect a solution?

Quick brush-up with Excel

Excel is to BI what wireframing is to application development. Brush up your Excel skills with 60+ formulas, pivots, charts & dashboards to quickly build a POC with small data before investing your time in building complex BI reports with big datasets.

Visualization with Power BI

Getting started with Power BI is simple. Then, once you want to leverage its full potential, you need a different set of skills. Learn how to develop these skills, unlock more insights through better data analysis and visualization with this section.

Advanced Calculation with DAX

Add analytical power to your Power BI model that is not available in the data as-is, using DAX. The goal of this section is to teach you basic to advance features of DAX, providing the knowledge to write formulas for common and advanced business scenarios.

M-Programming with Power Query

During this section, you'll learn how to perform advanced data transformations not available in the Query Editor. We will discuss how to leverage the embedded PowerBI programming language (M) to achieve this.

Model-building with Power Pivot

Explore the most powerful tool to build data models, forecast estimates, perform what-if-analysis scenario etc. If you are yet to have the Power BI license, you would still be able to create powerful & blended reports and share it internally using Power Pivot.

ETL with SSIS

Extract - Transform - Load. Extract Data from multiple data sources, transform it with SSIS inbuilt transformation options or use M-Programs with SSIS and, Load it to the Reporting Database or Data Warehouse for generating dynamic BI Reports.

Data warehousing using MS-SQL

Data for Power BI can come from many sources, but often the data is hosted in SQL Server. This section will teach you how to write accurate, effective, and robust T-SQL code- the right way and also understand the logic behind the same.

Modeling & Analytics with SSAS

In this section, you'll master SSAS Tabular, crafting optimized data models for lightning-fast analysis. You'll seamlessly integrate these models with BI tools, enabling real-time insights and building robust reporting solutions.

Architect Power BI Solution

This section will help you put together Excel, VBA, Power BI, DAX, Power Query and SQL to architect the best BI solution. You'll also learn to publish, securely share reports including row level permissions along with BI administrative tasks like setting up data gateways etc.

Taught by Microsoft Certified Trainers.

All our classes are live, hands-on and with real-trainers.

No recorded sessions.

Course Content Overview

A snapshot of what you'll be learning in 6-weeks.

Objective: To prepare a quick POC with small data and get the concurrence on the output before investing time on huge datasets.

Overview

  • Core Fundamentals Of Spreadsheets
  • How System Interprets Your Data
  • Crucial Formatting Concepts
  • Understanding Core Formula Fundamentals & Advanced Referencing Concepts
  • 60+ Advanced Excel Functions
  • Cleansing & Transforming Data
  • Data Summarization
  • Conditional Summarization
  • Working With Multiple Datasets
  • Working With Pivot Tables Including Advanced Pivot Tables Options
  • 15+ Charts - When To Use What Chart?
  • Develop Data Models to Simulate Complex Business Scenarios for What IF Analysis

Objective: To do faster queries, simpler DAX code and enjoy easier maintenance.

Introduction To PowerPivot

  • Limitation Of Excel Functions
  • Limitation Of Excel Pivot table
  • Why Powerpivot?
  • Powerpivot Features – Overview

Powerpivot Environment

  • Opening Powerpivot Environment
  • Understanding External Data Section
  • Understanding Formatting
  • Powerpivot Views
  • Understanding Measures

Loading Data Into PowerPivot

Calculated Columns

  • Calculated Columns
  • Entering Formulas
  • Using Autocomplete Feature
  • Renaming Columns
  • Understanding Tables

Creating Measures

  • Creating Simple DAX Measures
  • Explicit Measure Vs Implicit Measure
  • Referencing Measures In Other Measures
  • Formatting Measures
  • Manage Data Relationships
  • Working With Multiple Tables
  • Disconnected Tables
  • Creating Custom Calendars
  • Using Advanced Filter()
  • Advanced Calculated Columns
  • Understanding Relationship Concept
  • Join Tables
  • Left Join Tables
  • Right Join Tables

Data Visualization Using

  • Charts, Score Cards And Dashboards
  • Slicers
  • Map Visualizations
  • Data Binding And Formatting

Creating Advanced Dashboards With PowerPivot

Creating Free Form Reports With PowerPivot & Excel

Develop Simple Models And Forecast Data Using PowerPivot & Excel

Objective: Getting started with Power BI and leverage it’s full potential to develop compelling visualizations.

Building Blocks of Power BI

  • Visualizations
  • Datasets
  • Reports
  • Dashboards
  • Tiles

Building Your First Power BI Report

  • Connect to Data Sources in Power BI Desktop
  • Clean and Transform Your Data With the Query Editor
  • Create a report in Power BI Desktop
  • Publish the report in the Power BI service

Data Modeling with Power BI

  • Fundamentals of Modeling
  • How to Manage Your Data Relationships
  • Create Calculated Columns
  • Optimizing Data Models for Better Visuals
  • Create measures and work with time-based functions
  • Create Calculated Tables
  • Explore Time-Based Data

Visualizations

  • Create and Customize Simple Visualizations

Building compelling data visualizations

  • Identify metrics and pair them with appropriate data visuals
  • Using slicers
  • Creating Map Visualizations
  • Creating Tables and Matrixes
  • Creating Scatter Charts
  • Creating Waterfall and Funnel Charts
  • Using Gauges and Single Number Cards
  • Charting Options including Formatting with Colors, Shapes, Text Boxes, Images, etc.

Designing User-friendly reports

  • Customize themes
  • Create versatile layouts for your reports
  • Design principles to reduce noise and highlight data stories

Creating interactive reports for data exploration

  • Filtering & drilling for insights
  • Difference between filters & slicers
  • Filter pane for reporting needs

Exploring Data

  • Use Quick Insights in the Power BI service
  • Create and Configure A Dashboard
  • Share Dashboards with your organization
  • Display Visuals and Tiles Full-Screen 

Objective: To learn different methods to Transform Data before uploading it to the SQL Database.

Overview

  • Introduction
  • Loading & Refresh
  • Combine data from multiple data sources

Data Transformation

  • Editing Queries Created with Power Query
  • Editing Column Headers in Power Query
  • Splitting Column Data with Power Query
  • Sorting Data
  • Multi-Level Sorting
  • Filtering Data
  • Aggregate data from a column
  • Insert a custom column into a table
  • Merge columns
  • Remove columns
  • Remove rows with errors
  • Promote a row to column headers
  • Transforming Text Values
  • Replacing Data
  • Using the Fill command
  • Pivot and Unpivot Column
  • Transpose Query Data
  • Pivot Column Command in Action
  • Unpivot Columns Command
  • Grouping Data
  • Create a Duplicate Query
  • Group and Summarize Data
  • Advanced Data Grouping
  • Working with multiple sources in Power Query
  • Multiple Excel Tables
  • Expand a column containing an associated table
  • Understanding Table Relationships
  • Merging Queries

Loading Power Query Data to Destinations

  • Familiarity with the Load & Refresh Settings
  • Loading it to Workbook
  • Loading it to Data Model

Objective: To add analytical power to your Power BI model that is not available in the data as-is, using DAX.

Overview

  • What is DAX?
  • Data Types
  • Table-Valued Functions
  • Building a Calendar Table
  • Date and Time Functions
  • Filter Functions
  • Information Functions
  • Logical Functions
  • Mathematical and Trigonometric Functions
  • Statistical Functions
  • Text Functions
  • Time Intelligence Functions

Creating Advanced Dax Measures With Advanced Dax Functions

  • Calculate()
  • All()
  • Filter()
  • IF()
  • Switch()
  • SumX()

Evaluation Context

  • Filter Context
  • Row Context
  • Using RELATED in a Row Context
  • Filters and Relationships
  • USERELATIONSHIP

Hierarchies in DAX

Querying with DAX

Relationships

  • One-to-Many Relationships
  • Many-to-Many Relationships

Objective: To query MS-SQL Database (es) by writing accurate, effective, and robust T-SQL code - the right way.

Introduction to MS-SQL

  • Creating a Database
  • Understanding Tables and Creating Tables
  • Inserting, Updating and Deleting Data
  • Querying Data
  • Filtering Data
  • Grouping Data
  • Ordering Data
  • Column Aliases
  • Table Aliases

DDL INSIGHTS

  • CREATE TABLE
  • Dropping Objects
  • CREATE INDEX
  • TEMPORARY OBJECTS
  • Object Naming and Dependencies

SELECT STATEMENTS

  • Simple SELECTs
  • Calculated and Derived Fields
  • SELECT TOP / BOTTOM Records
  • Derived Tables
  • Joins
  • Predicates
  • Subqueries
  • Aggregate Functions
  • GROUP BY and HAVING
  • UNION
  • ORDER BY

Objective: Leverage DAX potential to perform advanced data analytics

Advanced Table Manipulation Functions

  • ADDCOLUMNS
  • CROSSJOIN
  • DATATABLE
  • DISTINCT column
  • EXCEPT
  • FILTERS
  • GENERATESERIES
  • INTERSECT
  • NATURALINNERJOIN
  • NATURALLEFTOUTERJOIN
  • ROW
  • SELECTCOLUMNS
  • SUMMARIZE
  • SUMMARIZECOLUMNS
  • Constructor
  • TOPN
  • UNION
  • VALUES

Advanced Filter Functions

  • ADDMISSINGITEMS
  • ALL
  • ALLCROSSFILTERED
  • ALLEXCEPT
  • ALLSELECTED
  • CALCULATE
  • DISTINCT
  • FILTER
  • FILTERS
  • RELATED
  • REMOVEFILTERS
  • SELECTEDVALUE
  • USERELATIONSHIP
  • VALUES

ADVANCED USAGE OF

  • CALCULATE
  • SUMX
  • COUNTX
  • AVERAGEX
  • MAXX
  • MINXX
  • DATATABLE

Objective: To perform advanced and complex data transformations not available in the Query Editor

Understanding M Programming Code

  • M LANGUAGE Specifications
  • Lexical Structure
  • Basic Concepts
  • Values
  • Types
  • Operators
  • Let
  • Conditionals
  • Functions
  • Error Handling
  • Creating Simple M Expressions
  • Creating Simple M Functions
  • Working with List, Record & Tables
  • Understanding Operators and Evaluation Methods
  • Data Types & Type Conversions

Working with M Functions

  • ACCESSING DATA FUNCTIONS - From Excel, SQL, CSV, Tab-Delimited, Webpage, XML, JSON, SharePoint, etc.
  • COMBINER FUNCTIONS
  • COMPARER FUNCTIONS
  • DATE FUNCTIONS
  • DATETIME FUNCTIONS
  • DURATION FUNCTIONS
  • LIST FUNCTIONS
  • LOGICAL FUNCTIONS
  • NUMBER FUNCTIONS
  • RECORD FUNCTIONS
  • REPLACER FUNCTIONS
  • SPLITTER FUNCTIONS
  • TABLE FUNCTIONS
  • TEXT FUNCTIONS
  • TIME FUNCTIONS
  • TYPE FUNCTIONS
  • VALUE FUNCTIONS

Objective: Get hands-on experience with advanced administration settings, permissions, Data refresh times etc.

Overview

  • Publishing Power BI Reports
  • Creating & Managing Workspaces and Its Access
  • Creating & Managing Dashboard and Its Access
  • Installing & Configuring Data gateway
  • Scheduling and configuring data refresh
  • Managing & Reusing Datasets
  • Scheduling Report Alerts
  • Setting up Row Level Permissions
  • Managing Users & Audit Log
  • Custom Branding Power BI For your Organization
  • Adding Custom Visuals for your Organization

Objective: Developing expertise in SSAS Tabular for creating high-performance data models vital for real-time analysis and integrated BI reporting solutions.

Overview

  • Core Fundamentals of VBA
  • Understanding VBA Environment
  • Writing simple VBA Codes
  • Concept of Variables & Data Types
  • Testing & Debugging Code
  • Understanding Fundamental Coding Blocks
  • IF Block
  • Select Case
  • And / Or Conditions
  • Understanding Fundamentals of Looping
  • For Loop
  • Do While
  • Understanding Object Based Programming
  • Advanced Excel Automations
  • Word Automation
  • Outlook Automation
  • Working with Database
  • Working with Web Browsers - Web Scrapping
  • Creating User Interfaces with VB Forms
  • Handling Run Time Errors & Securing Code

Objective: Developing expertise in SSAS Tabular for creating high-performance data models vital for real-time analysis and integrated BI reporting solutions.

SSAS Tabular Modeling - Introduction

  • Understanding SSAS
  • Creating Calculated Columns
  • Installing Visual Studio
  • Configuring Tabular Mode Environment
  • Importing sample datasets
  • Configuring a workspace server
  • SSAS project properties

Creating & Working with Simple SSAS Tabular Models

  • Adding data into tabular models
  • Installing and configuring a development environment
  • Creating Simple Measures
  • Creating Calculated Tables
  • Creating Calendar Tables
  • Creating and Working with Hierarchies
  • Working with Model Views
  • Working in Tabular Models & KPIs
  • Setting Relationships
  • Creating and deploying Simple Model
  • Use the models via SSMS, Excel & Power BI

Administering SSAS Tabular Models

  • Working with tabular model properties
  • Creating and working with partitions
  • Working with Roles
  • Server Properties
  • Managing SSAS Memory

SSAS Tabular Model - Security

  • Understanding Tabular Models Security
  • Set up row-level security
  • Set up dynamic filter security

Working with DAX Functions in SSAS Tabular Models

  • Creating Measures
  • Creating Calculates Columns
  • Using the Power BI DAX functions learnt in SSAS Tabular
  • Working with Calendar Tables
  • Date & Time Intelligence Functions

Connecting & Working with SSAS Tabular Models in Power BI

Objective: Extract Data from multiple data sources, transform them with SSIS or M-Program transformation options and, Load it to Reporting Database / Data Warehouse

Understanding SSIS Packages

Creating & Managing Connections with Connection Manager

  • Importing Data With ADO.NET
  • Importing Data From Excel
  • Importing Data From Flat Files
  • Importing Data From FTP
  • Importing Data From SMTP
  • Working with Multiple Connections
  • Working with Control Flows
  • Working with Data Flows
  • Working with Variables & Expressions

Performing Transformations

  • Aggregation Transformations
  • Audit Transformations
  • Conditional Split Transformations
  • Data Conversion Transformations
  • DQS Cleansing Transformations
  • Derived Columns Transformations
  • Export Column Transformation
  • Fuzzy Grouping Transformation
  • Fuzzy Lookup Transformation
  • Lookup Transformation
  • Merge Transformation
  • Merge Join Transformation
  • Pivot Transformation
  • Unpivot Transformation
  • Row Count Transformation
  • Sort Transformation

Loading Data to SQL Server

Advanced SQL Concepts

DML INSIGHTS

  • INSERT
  • UPDATE
  • DELETE
  • Detecting DML Errors

Understanding Data Types

  • Dates
  • Strings
  • Numeric
  • BLOBs
  • Bits
  • UNIQUEIDENTIFIER
  • Cursor Variables
  • Timestamps

DDL INSIGHTS

  • CREATE TABLE
  • Dropping Objects
  • CREATE INDEX
  • TEMPORARY OBJECTS
  • Object Naming and Dependencies

SQL VIEWS

  • Create & Manage VIEWs
  • Getting a VIEW's Source Code
  • Updatable VIEWs
  • Derived Tables
  • Dynamic VIEWs
  • Partitioning Data Using Views
  • View Restrictions

Stored Procedures

  • Stored Procedure Advantages
  • Internals
  • Creating Stored Procedures, Executing Stored Procedures
  • Environmental Concerns
  • Parameters for Procedures
  • Important Automatic Variables
  • Flow Control Language
  • Errors
  • Nesting
  • AutoStart Procedures
  • User Defined Functions
  • Scalar UDFs
  • Table-Valued UDFs
  • Per-Row UDFs

Working with Date & Time

  • Date and Time Data Types
  • Date and Time Manipulation
  • Date and Time Functions
  • Literals
  • Identifying Weekday
  • Handling Date-only or Time-only Data Prior to SQL Server 2008
  • Examples of Date and Time Calculations
  • Rounding Issues
  • Date- and Time-Related Querying Problems
  • Age Problems
  • Overlaps
  • Grouping by the Week
  • Working Days
  • Generating a Series of Dates

SETS

  • Unions
  • Differences
  • Intersections
  • Subsets

Transactions

  • Transactions Defined
  • How SQL Server Transactions Work
  • Types of Transactions
  • Avoiding Transactions Altogether
  • Automatic Transaction Management
  • Transaction Isolation Levels
  • Transaction Commands and Syntax
  • Debugging Transactions
  • Optimizing Transactional Code

Objective: To put our entire learning to use and arrive at the best possible BI solution -using the right combination of available technologies.

Overview

  • Case Study 1
  • Case Study 2
  • Case Study 3

System Requirements

  1. Power BI Desktop

    Free & Downloadable from Microsoft Store App

    https://www.microsoft.com/store/productid/9NTXR16HNW1T?ocid=pdpshare

  2. Excel 2016 & above with PowerPivot

    Available with Office 365 subscriptions that include desktop versions of Excel for Windows.

  3. MS-SQL Server

    https://www.microsoft.com/en-in/sql-server/sql-server-downloads

    Kindly install Developer Edition as it is full-featured free edition, licensed for use as a development and test database in a non-production environment.

  4. SQL Server Management Studio (SSMS)

    Download and install SSMS from https://learn.microsoft.com/en-us/sql/ssms/download-sql-server-management-studio-ssms?view=sql-server-ver16

Course Fee

$ 1999* Reserve My Seat

Connect with Us

Mr. Perrie Smith

Business Associate

Tel: +1 650 491 3131

Email: inquiry_fsbi@excelgoodies.com

Connect us on

Course Fee

$ 1999*

What's included?

  • 8 Excel Reports & Models
  • 12 Power BI + DAX Dashboards
  • 6 Power Query Projects
  • 6 Power Pivot Models
  • 7 ETL Projects
  • 5 MS-SQL Projects
  • 14 VBA Automation Scenarios
  • 4 Power BI + DAX + PQ Based Dashboards
  • 3 Power BI + DAX + PQ + SQL Based Dashboards
  • 9 Master Projects Using Power BI, DAX, PQ, SQL
    VBA, Web-Scrapping, API Integration, etc.

Training Schedule

Week 1 - Quick Excel Brush-up & Power BI

Mon, May 13 through Fri, May 17

11:00 AM to 1:30 PM ET

Week 2 - DAX Function & Power Query

Mon, May 20 through Fri, May 24

11:00 AM to 1:30 PM ET

Week 3 - Power Pivot, T-SQL & Power BI Administration

Tue, May 28 through Fri, May 31

11:00 AM to 1:30 PM ET

Week 4 - Advanced DAX Function & M-Programming

Mon, June 10 through Fri, June 14

11:00 AM to 1:30 PM ET

Week 5 - Ad-hoc Automations using VBA Macro

Mon, June 17 through Fri, June 21

11:00 AM to 1:30 PM ET

Week 6 - ETL with MS-SQL , SSIS , SSAS and Architect BI Solution

Mon, June 24 through Fri, June 28

11:00 AM to 1:30 PM ET

NEW

Upcoming Batch

Starts On

Time

Course Fee

$1999*

*($1299 for Excelgoodies Power BI Students)

Or Click here to view next cohort dates.

CORPORATE
Training 5 or
more people?

Avail additional 10% Corporate Benefit*
on the total course fee for 5+ participants.
Get you team BI ready, today.

*Available until Apr 30, 2024.

Training Schedule

Week 1 - Quick Excel Brush-up & Power BI

Mon, May 13 through Fri, May 17

11:00 AM to 1:30 PM ET

Week 2 - DAX Function & Power Query

Mon, May 20 through Fri, May 24

11:00 AM to 1:30 PM ET

Week 3 - Power Pivot, T-SQL & Power BI Administration

Tue, May 28 through Fri, May 31

11:00 AM to 1:30 PM ET

Week 4 - Advanced DAX Function & M-Programming

Mon, June 10 through Fri, June 14

11:00 AM to 1:30 PM ET

Week 5 - Ad-hoc Automations using VBA Macro

Mon, June 17 through Fri, June 21

11:00 AM to 1:30 PM ET

Week 6 - ETL with MS-SQL , SSIS , SSAS and Architect BI Solution

Mon, June 24 through Fri, June 28

11:00 AM to 1:30 PM ET

Week 1 - Quick Excel Brush-up & Power BI

Tue, Jan 08 through Fri, Jan 12

11:00 AM to 1:30 PM ET

Week 2 - DAX Function & Power Query

Mon, May 20 through Fri, May 24

11:00 AM to 1:30 PM ET

Week 3 - Power Pivot, T-SQL & Power BI Administration

Tue, May 28 through Fri, May 31

11:00 AM to 1:30 PM ET

Week 4 - Advanced DAX Function & M-Programming

Mon, June 10 through Fri, June 14

11:00 AM to 1:30 PM ET

Week 5 - Ad-hoc Automations using VBA Macro

Mon, June 17 through Fri, June 21

11:00 AM to 1:30 PM ET

Week 6 - ETL with MS-SQL , SSIS , SSAS and Architect BI Solution

Mon, June 24 through Fri, June 28

11:00 AM to 1:30 PM ET

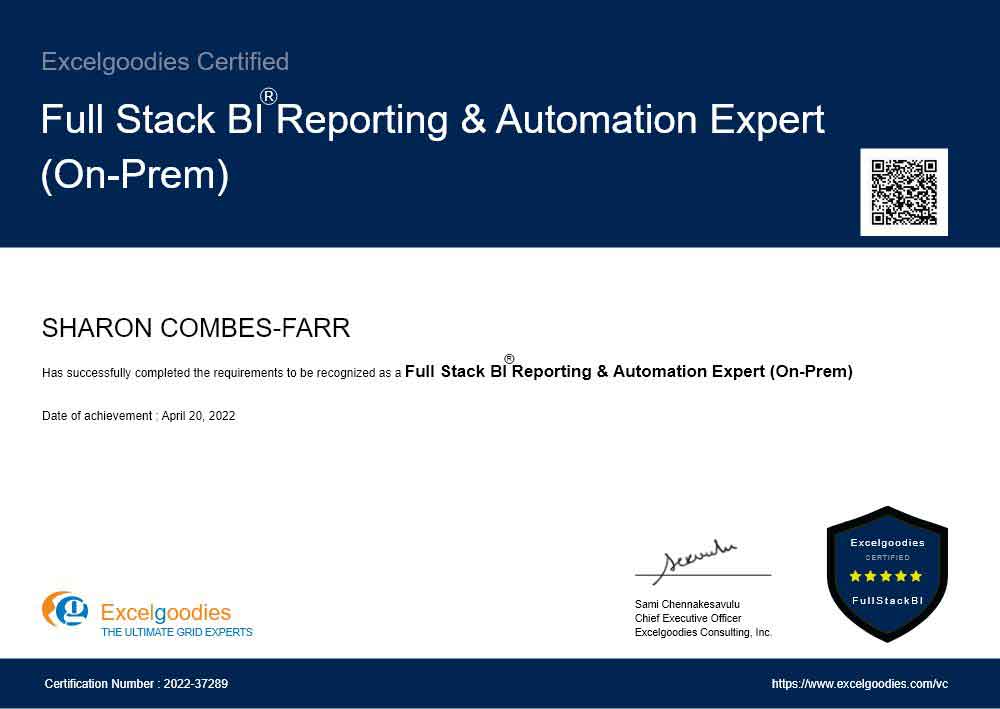
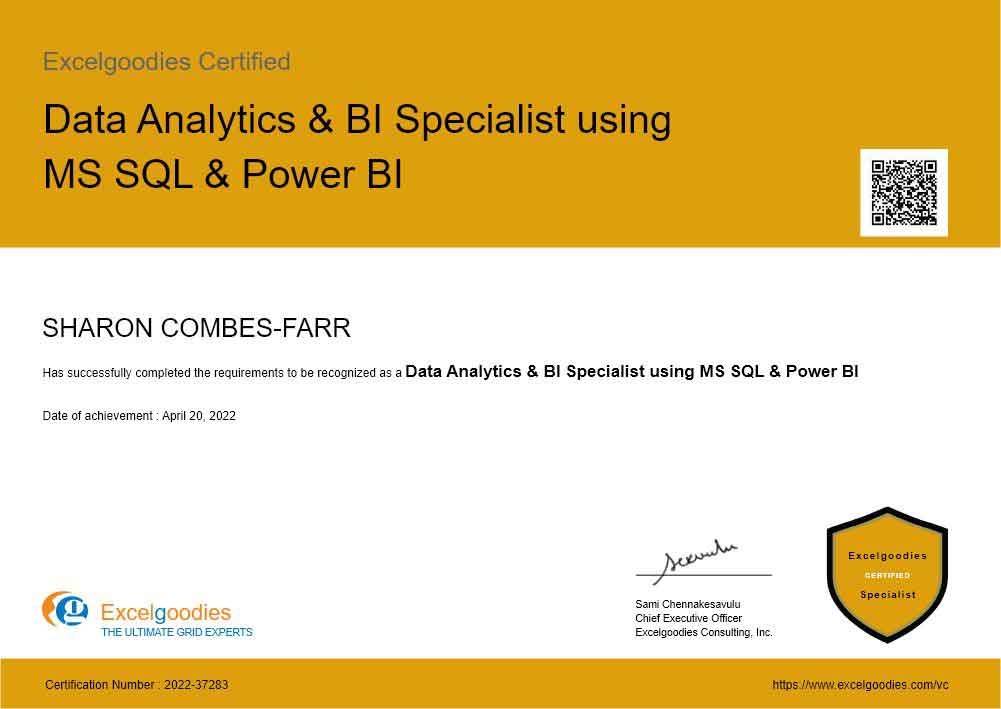
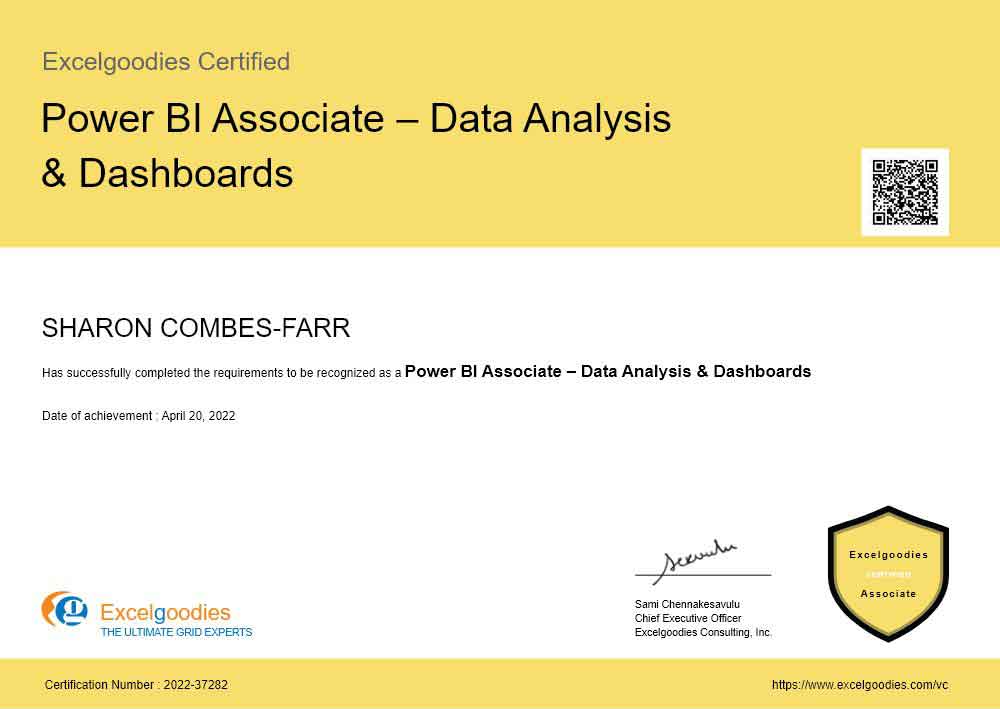
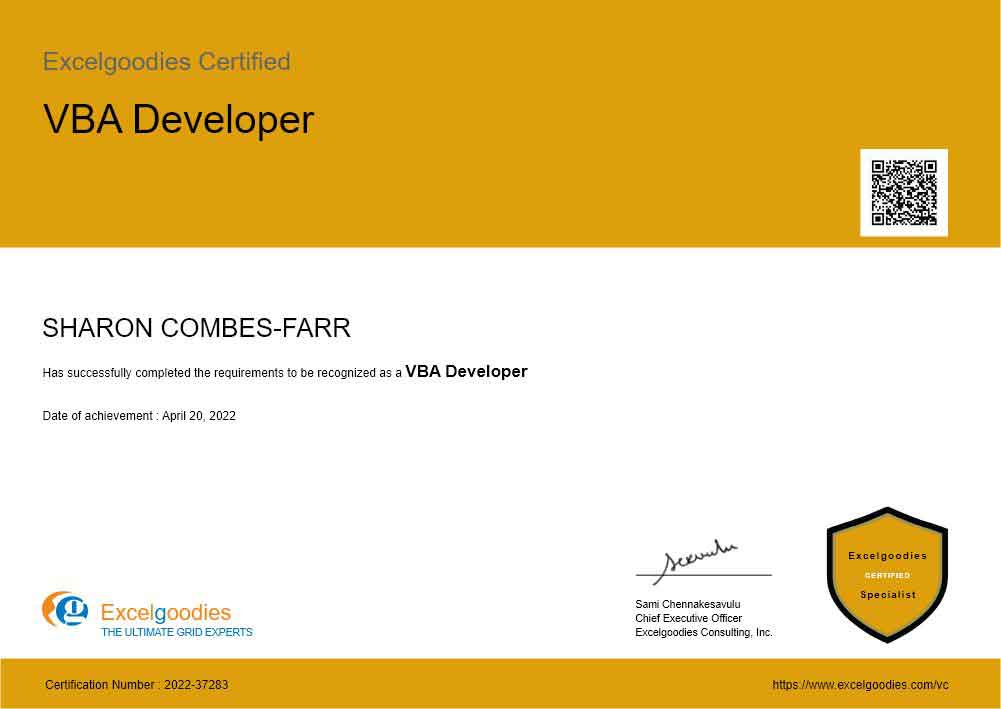
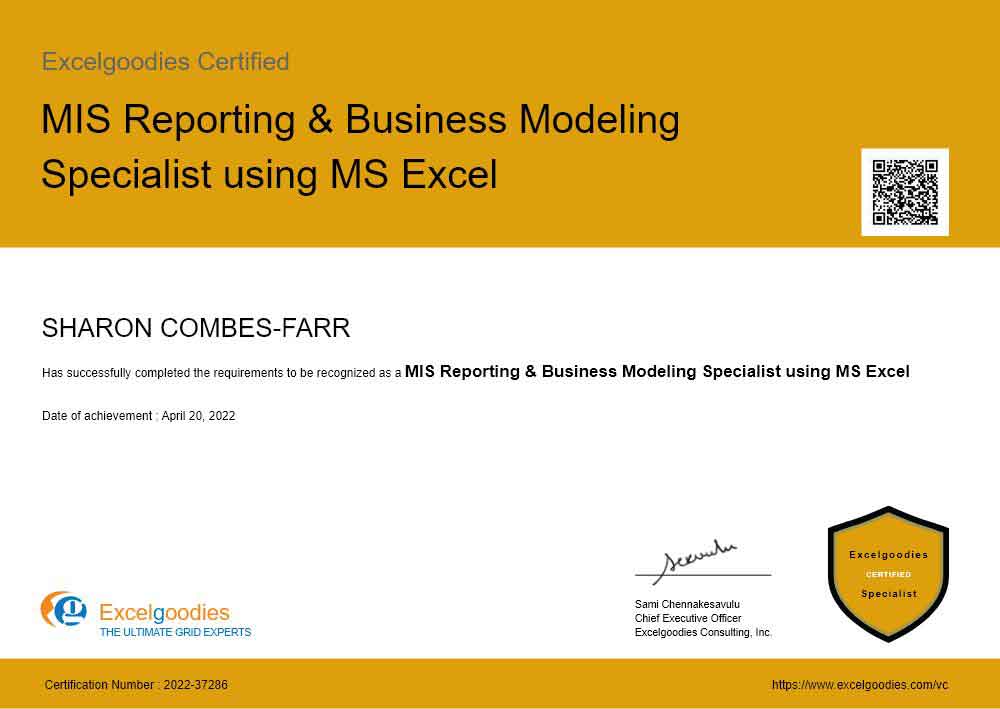
9 Specialist Certificates

You'll honored with total of 9-certificates
throughout the program.

About Your Trainer

Mr. Sami

MCT, MCP, MEE, MOS

Mr. Sami

MCT, MCP, MEE, MOS

30,000+

Students Trained

18+

Year of Experience

4.9

Reviews

Mr. Sami is an exceptionally accomplished and certified Microsoft Trainer, possessing extensive expertise in the fields of Finance, HR, and Information Technology. With an impressive 14-year tenure in the industry, he has successfully trained and empowered over 23,000 professionals, and the number continues to grow.

He has undertaken assignments with the renowned IRS, The World Bank, Tata Chemicals, Buckman Laboratories, Standard Chartered, ING Barings and much more. His nature of going that Extra Mile has got him the startling popularity amongst the Excelgoodies prominent clients.

With his wealth of knowledge and dedication to delivering exceptional training experiences, Mr. Sami consistently exceeds the expectations of his clients and leaves a lasting impact on the professionals he trains.

Mr. Sami is an exceptionally accomplished and certified Microsoft Trainer, possessing extensive expertise in the fields of Finance, HR, and Information Technology. With an impressive 14-year tenure in the industry, he has successfully trained and empowered over 23,000 professionals, and the number continues to grow.

Throughout his illustrious career, Mr. Sami has collaborated with esteemed organizations such as the IRS, The World Bank, Mercedez-Benz, Comcast, Standard Chartered, and ING Barings, to name just a few. His unwavering commitment to going the extra mile has earned him a stellar reputation among Excelgoodies' prominent clients.

With his wealth of knowledge and dedication to delivering exceptional training experiences, Mr. Sami consistently exceeds the expectations of his clients and leaves a lasting impact on the professionals he trains.

9 Specialized Certificates

You'll honored with total of 9-certificates through-out the program.

1

EG-901

Level :

2

EG-902

Level :

3

EG-903

Level :

4

EG-904

Level :

5

EG-905

Level :

6

EG-906

Level :

7

EG-907

Level :

8

EG-908

Level :

9

FSBI-001

Level :

What skills I'll gain?

Alternate Text

Interesting Careers to Explore after Full Stack BI Course

The average annual salary for a Data Professional in the US is $80,000 to over $120,000 (Source: ZipRecruiter & Gartner).

Esteemed Clientele

Learner stories around
the world

Total Reviews

4583

Overall growth till now

Average Rating

4.9

Average rating this year

Graph

5

2.0K

4

1.0K

3

500

2

200

1

0

Star Rating

Trainer's Expertise

Course Structure

Course Content

Assignments

Certification Process

Scott A. Reifsynder

Power BI Training

Chief Financial Officer

Nexterus

United States

This class was extremely helpful in my knowledge and growth in these database, analysis and reporting tools. I really enjoyed the hands-on approach and got lots of “goodies” out of all the classes. Your approach, repetitiveness and patience is much appreciated and sincerely helped me learn how to accomplish these important tasks. Doing these activities again and again embedded these processes into my routines while I began strategizing how to best utilize these tools in my company’s reporting and analyses. I’d be happy to consider additional classes that you offer on related, important topics to continue enhancing my skills. Thank you very much for your teaching and training methods. I am also very grateful that you provided the daily sample dashboards, instruction steps and how-to descriptions.

Wendy Flowers

Power BI Training

Financial and Business Analyst

First Light

United States

This Power BI course was an exceptional training experience. It was very fast paced -- necessary as it covered Power Pivots, Power Query, DAX, Power BI, and SQL. Sami ran the training smoothly, staying after to help individuals with questions. We also are able to schedule up to two 30-minute sessions after the end of the course for guidance on projects. Highly recommend!

Tim Palacios

Power BI Training

WFM Data Developer

World Connection

United States

This course was excellent. Sami had a systematic approach to the course curriculum which I feel is key to most if not all learning experiences. He was very knowledgeable and very quick with troubleshooting and helping support when we had any challenges with our work. I am definitely going to take more courses from Excelgoodies. If you are an IT professional or require Data Analytics for your job, this is a great course and I highly recommend it. I think my only critique is that I would have like to have more time devoted to the database side of the class, but that is just a personal preference.

Learner stories
around the world

Total Reviews

4583

Overall growth till now

Average Rating

4.9

Average rating this year

Registration Closes on
Friday, 10 May.

Prove you're human: Type the code shown.

=

Industry Insights

FSBI

Why does FSBI Specialist earns 30%-50% more than BI experts?

FSBI

Exploring the Different Roles and Career Paths in FSBI & Automation

FSBI

Real-World Business Scenario: PwC Case Study – From Weeks to hours

Connect with Us

Excelgoodies Consulting, inc.
575, 7th Avenue, 5th Floor
New York City, NY 10018

Mr. Perrie Smith

Business Associate

ENQUIRY

+1 650 491 3131

CONNECT

APPLICATION DEADLINE

Application Deadline

Registration Closes on Fri, 10 May.

Prove you're human: Type the code shown.

=