Business Professionals
Techno-Business Professionals
Power BI | Power Query | Advanced DAX | SQL - Query &
Programming
Microsoft Fabric | Power BI | Power Query | Advanced DAX |
SQL - Query & Programming
Microsoft Power Apps | Microsoft Power Automate
Power BI | Adv. DAX | SQL (Query & Programming) |
VBA | Web Scrapping | API Integration
Power BI | Power Apps | Power Automate |
SQL (Query & Programming)
Power BI | Adv. DAX | Power Apps | Power Automate |
SQL (Query & Programming) | VBA | Web Scrapping | API Integration
Power Apps | Power Automate | SQL | VBA |
Web Scraping | RPA | API Integration
Technology Professionals
Power BI | DAX | SQL | ETL with SSIS | SSAS | VBA
Power BI | SQL | Azure Data Lake | Synapse Analytics |
Data Factory | Azure Analysis Services
Microsoft Fabric | Power BI | SQL | Lakehouse |
Data Factory (Pipelines) | Dataflows Gen2 | KQL | Delta Tables
Power BI | Power Apps | Power Automate | SQL | VBA | API Integration
Power BI | Advanced DAX | Databricks | SQL | Lakehouse Architecture
6 Weeks | 60 Hours
30 Sessions, 2 Hrs Each
Live Online, Instructor-Led
Batch starts on
th
For Modern Cloud BI & Data Engineers
Where Data Engineering Meets Scalable BI.
Built for professionals designing data solutions on the modern Lakehouse stack, this course helps you master Databricks integration with Power BI, optimize pipelines, and deliver analytics at cloud scale. Gain the expertise to bridge raw data and business insights — the skillset every enterprise now demands.
Engineer Scalable Data Pipelines – Automate and orchestrate workflows using Databricks Workflows.
Build a Unified Lakehouse – Manage structured and unstructured data with Delta Lake and Azure Data Lake.
Transform Data at Scale – Cleanse, process, and enrich data using SQL, PySpark, and Python.
Integrate BI Seamlessly – Connect Databricks with Power BI to deliver real-time analytics and insights.
Optimize for Performance & Governance – Caching, security, and tuning best practices.
Power Business Decisions – Deliver production-grade, cloud-scale BI that bridges data engineering and analytics.
Cloud Data Engineers
Building scalable data pipelines with Databricks and Delta Lake.
BI Developers
Connecting Power BI with Databricks for cloud-scale analytics.
Data Analysts
Using Databricks SQL and Power BI for advanced reporting.
Data Architects
Designing unified, secure Lakehouse architectures.
ETL Specialists
Automating data ingestion and transformation workflows.
Tech Leads & Decision Makers
Modernizing enterprise BI with the Databricks Lakehouse.
A snapshot of what you'll be learning in 6-weeks.
Objective: Get hands-on experience with advanced administration settings, permissions, Data refresh times etc.
Work on real-world projects using Azure Databricks, and Power BI to design scalable ETL pipelines, manage Delta Lake, and deliver real-time analytics. Gain practical, job-ready skills to master the end-to-end data lifecycle — from ingestion to insight.
Enterprise Sales Performance Dashboard
Develop an interactive Power BI dashboard to analyze regional and product-wise sales performance. Utilize DAX measures for YOY growth, sales variance, and customer segmentation, while Power Query is used to clean and transform raw sales data from multiple sources.
Customer Churn Prediction
Build a churn prediction model by integrating customer interaction data, support tickets, and transactional history. Use Power Query for data transformation and DAX measures to calculate churn probability based on behavioral patterns.
HR Analytics & Workforce Planning
Create an HR dashboard to track employee retention, hiring trends, and performance metrics. Connect multiple data sources to Power BI, apply DAX formulas to calculate attrition rates, and implement role-based security for restricted views.
Supply Chain & Inventory Optimization
Design a Power BI solution to monitor inventory levels, supplier performance, and stock movement across locations. Use Power Query to merge purchase order data with warehouse stock levels and apply DAX for predictive analytics on stock replenishment.
Financial Reporting & Budget vs. Actuals Analysis
Automate financial reporting using DAX calculations for variance analysis, custom KPIs, and trend forecasting. Apply Power Query transformations to consolidate financial statements from different departments into a unified report.
Sales & Marketing Data Integration
Combine sales and marketing datasets from multiple sources using PySpark and SQL. Cleanse data, handle missing values, and create aggregated tables for downstream analytics.
Customer Segmentation & LTV
Analyze customer behavior using PySpark to calculate lifetime value, segment customers, and generate insights for targeted marketing campaigns.
Product Performance Analysis
Use PySpark to calculate product-level KPIs, perform trend analysis, and create summary tables for reporting in Power BI.
Streaming Event Log Processing
Ingest and transform application log data in Databricks using PySpark streaming. Aggregate metrics for operational monitoring and anomaly detection.
Data Validation & Quality Checks
Build SQL and PySpark scripts to validate datasets, enforce constraints, and identify inconsistencies before loading into Delta Lake.
Automated Sales ETL Pipeline
Ingest daily sales CSV/JSON files from Azure Data Lake, transform using Databricks, and load into Delta Lake tables for reporting.
Batch Data Processing Pipeline
Design a pipeline that processes historical data in batches, aggregates KPIs, and refreshes analytics tables automatically.
Real-Time Streaming Pipeline
Ingest live IoT or clickstream data into Databricks, perform transformations, and store in Delta Lake for real-time dashboards.
Data Quality & Validation Pipeline
Automate data validation steps, generate alerts for anomalies, and ensure only clean, verified data is loaded for analytics.
Pipeline Monitoring & Logging
Create dashboards and alerts to monitor ETL workflow health, runtime performance, and data freshness.
Delta Table Management
Implement ACID-compliant Delta Lake tables, perform updates, deletes, and optimize table performance.
Time Travel Analytics
Use Delta Lake time travel to query historical versions of data and generate trend analyses for business reporting.
Partitioning & Optimization
Partition large tables to improve query performance, reduce storage costs, and speed up downstream analytics.
Lakehouse Integration Project
Integrate structured and unstructured datasets into a unified Lakehouse architecture for enterprise reporting.
Data Governance & Security
Apply access controls, enforce schema validation, and implement lineage tracking in Delta Lake tables.
Data Cleansing Pipeline for Lakehouse
Use Python (via Notebooks in Fabric) to clean, deduplicate, and normalize raw CSV/parquet files before storing them in Delta format in the Fabric Lakehouse. Integrate with a Data Factory pipeline for scheduled ingestion.
Automated Data Quality Checks on Delta Tables
Build a reusable Python script to perform column-level validation (null checks, data types, range thresholds) on Delta tables in the Lakehouse. Automatically log failures to a monitoring table and trigger alerts.
Generate KPI Summary Tables for Power BI
Write a Python routine to compute summary KPIs (e.g., weekly sales, customer retention, churn rates) and store results in a Gold layer table. These output tables are optimized for reporting in Power BI dashboards.
Notebook-Driven ETL for Semi-Structured Data
Automate ETL for JSON or nested data (e.g., API exports, logs) using Python in a Fabric Notebook. Transform and flatten the data structure, then write the result into Delta tables for KQL/Power BI consumption.
Automated Archival and Partition Management
Use Python to periodically move older data partitions to cold storage and maintain optimized table size for querying. This improves performance and cost-efficiency within the Lakehouse.
Develop an interactive Power BI dashboard to analyze regional and product-wise sales performance. Utilize DAX measures for YOY growth, sales variance, and customer segmentation, while Power Query is used to clean and transform raw sales data from multiple sources.
Build a churn prediction model by integrating customer interaction data, support tickets, and transactional history. Use Power Query for data transformation and DAX measures to calculate churn probability based on behavioral patterns.
Create an HR dashboard to track employee retention, hiring trends, and performance metrics. Connect multiple data sources to Power BI, apply DAX formulas to calculate attrition rates, and implement role-based security for restricted views.
Design a Power BI solution to monitor inventory levels, supplier performance, and stock movement across locations. Use Power Query to merge purchase order data with warehouse stock levels and apply DAX for predictive analytics on stock replenishment.
Automate financial reporting using DAX calculations for variance analysis, custom KPIs, and trend forecasting. Apply Power Query transformations to consolidate financial statements from different departments into a unified report.
Combine sales and marketing datasets from multiple sources using PySpark and SQL. Cleanse data, handle missing values, and create aggregated tables for downstream analytics.
Analyze customer behavior using PySpark to calculate lifetime value, segment customers, and generate insights for targeted marketing campaigns.
Use PySpark to calculate product-level KPIs, perform trend analysis, and create summary tables for reporting in Power BI.
Ingest and transform application log data in Databricks using PySpark streaming. Aggregate metrics for operational monitoring and anomaly detection.
Build SQL and PySpark scripts to validate datasets, enforce constraints, and identify inconsistencies before loading into Delta Lake.
Ingest daily sales CSV/JSON files from Azure Data Lake, transform using Databricks, and load into Delta Lake tables for reporting.
Design a pipeline that processes historical data in batches, aggregates KPIs, and refreshes analytics tables automatically.
Ingest live IoT or clickstream data into Databricks, perform transformations, and store in Delta Lake for real-time dashboards.
Automate data validation steps, generate alerts for anomalies, and ensure only clean, verified data is loaded for analytics.
Create dashboards and alerts to monitor ETL workflow health, runtime performance, and data freshness.
Implement ACID-compliant Delta Lake tables, perform updates, deletes, and optimize table performance.
Use Delta Lake time travel to query historical versions of data and generate trend analyses for business reporting.
Partition large tables to improve query performance, reduce storage costs, and speed up downstream analytics.
Integrate structured and unstructured datasets into a unified Lakehouse architecture for enterprise reporting.
Apply access controls, enforce schema validation, and implement lineage tracking in Delta Lake tables.
Use Python (via Notebooks in Fabric) to clean, deduplicate, and normalize raw CSV/parquet files before storing them in Delta format in the Fabric Lakehouse. Integrate with a Data Factory pipeline for scheduled ingestion.
Build a reusable Python script to perform column-level validation (null checks, data types, range thresholds) on Delta tables in the Lakehouse. Automatically log failures to a monitoring table and trigger alerts.
Write a Python routine to compute summary KPIs (e.g., weekly sales, customer retention, churn rates) and store results in a Gold layer table. These output tables are optimized for reporting in Power BI dashboards.
Automate ETL for JSON or nested data (e.g., API exports, logs) using Python in a Fabric Notebook. Transform and flatten the data structure, then write the result into Delta tables for KQL/Power BI consumption.
Use Python to periodically move older data partitions to cold storage and maintain optimized table size for querying. This improves performance and cost-efficiency within the Lakehouse.
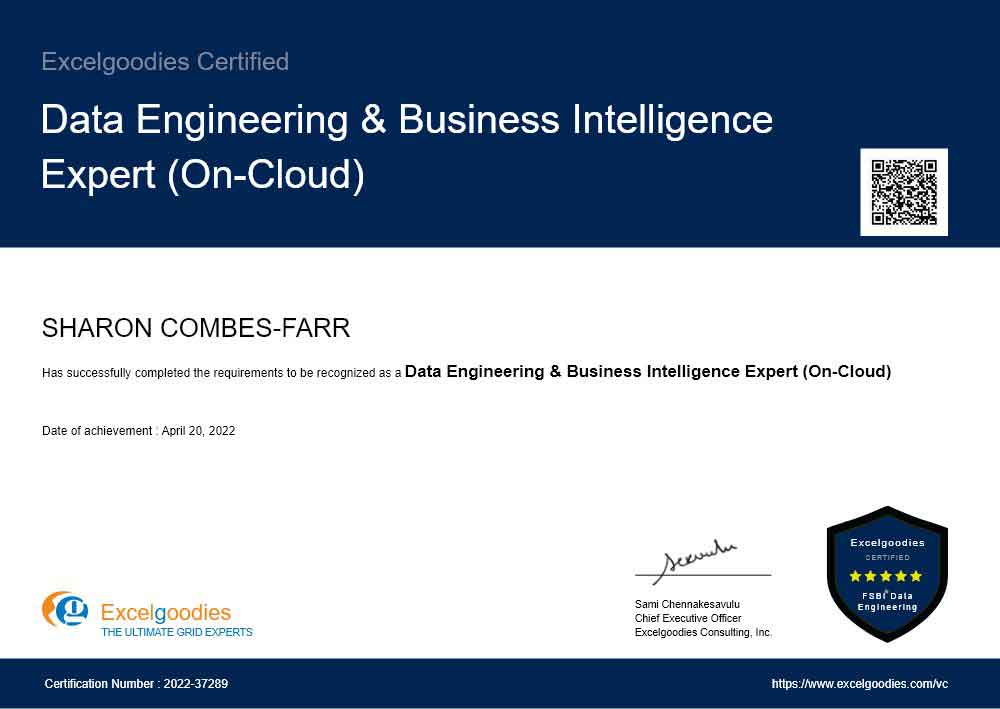
Data Engineering & Business Intelligence Expert (On-Cloud)
Fabric Data Engineering Specialist
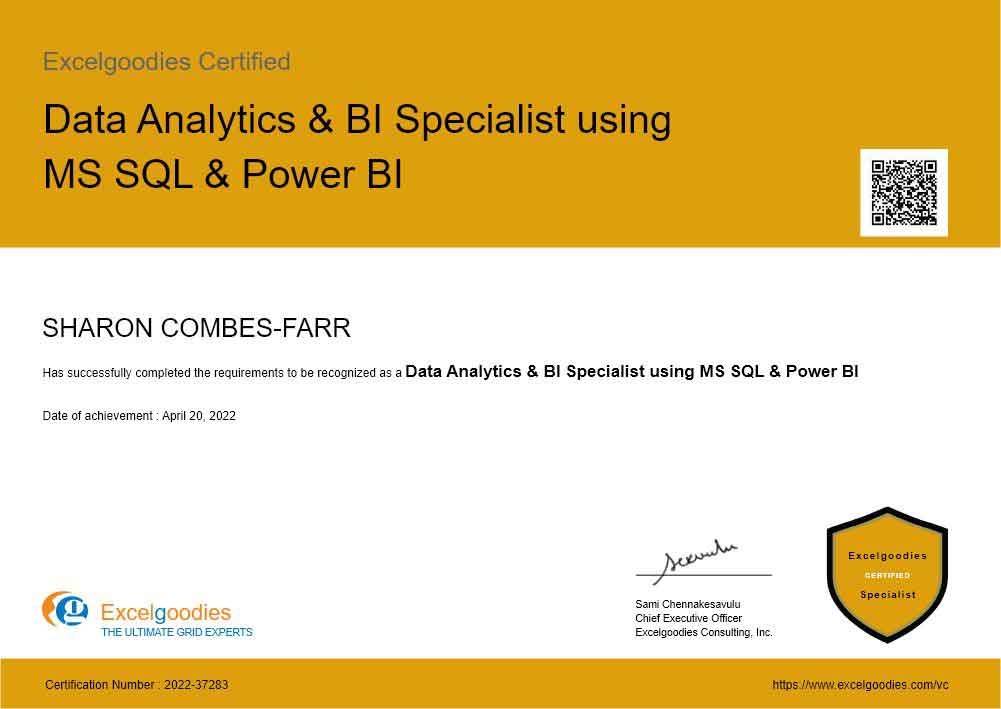
Data Analytics & BI Specialist using MS-SQL and Power BI
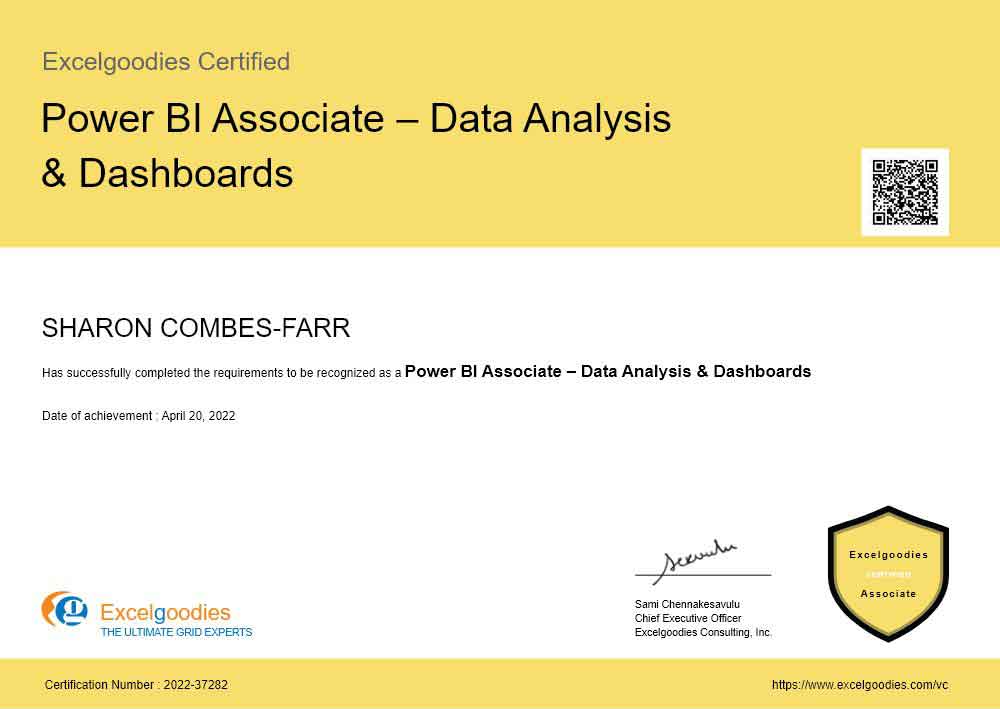
Power BI Associate
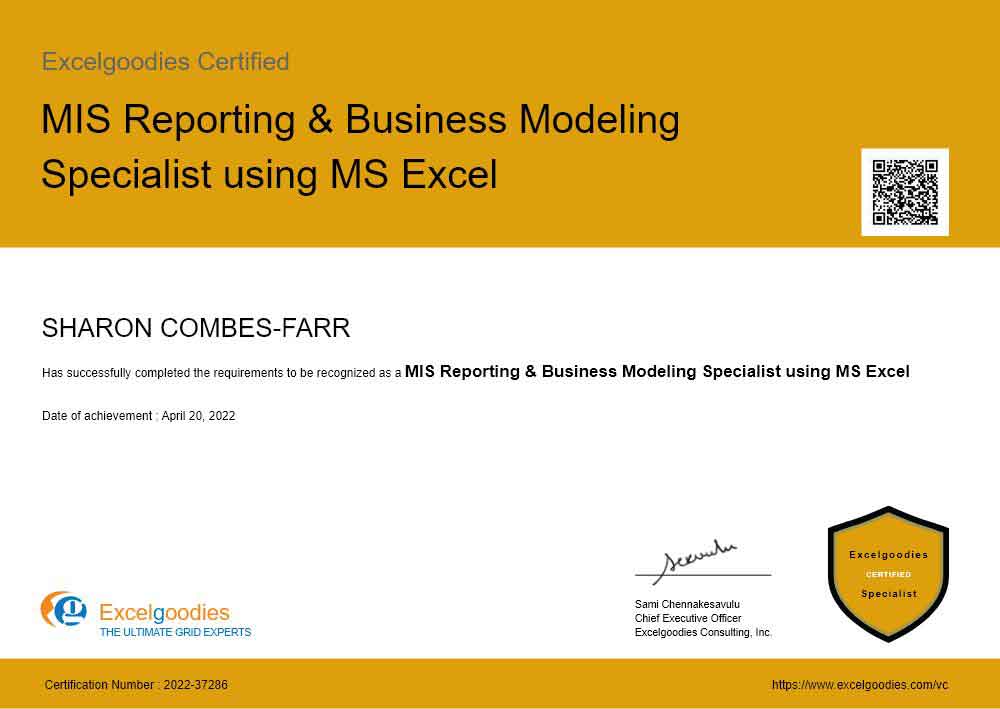
MIS Reporting & Business Modeling Specialist using MS Excel
Shareable certificate
Add to your LinkedIn profile
Data Engineering & Business Intelligence Expert (On-Cloud)
Level : EXPERT
Certificate Code : EG-EXP-105
Eligibility : On clearing post-training assessment
Fabric Data Engineering Specialist
Level : SPECIALIST
Certificate Code : EG-SPL-008
Eligibility : On clearing post-training assessment
Data Analytics & BI Specialist using MS-SQL and Power BI
Level : SPECIALIST
Certificate Code : EG-SPL-004
Eligibility : On clearing post-training assessment
Power BI Associate
Level : ASSOCIATE
Certificate Code : EG-ASC-003
Eligibility : On clearing post-training assessment
MIS Reporting & Business Modeling Specialist using MS Excel
Level : SPECIALIST
Certificate Code : EG-SPL-001
Eligibility : On clearing post-training assessment
Limited Seats. Registration Closing Soon
Databricks is one of the fastest-growing platforms for cloud data engineering and analytics. Learning Databricks with Power BI equips you to build scalable ETL pipelines, manage Delta Lake, and deliver real-time insights. Companies adopting modern Lakehouse architectures are actively seeking professionals with these skills, making this combination highly valuable for career growth.
A basic understanding of SQL or data concepts helps, but this course is designed for data engineers, BI developers, and analytics professionals at various experience levels who want to upskill in cloud data engineering.
Yes, Databricks requires a subscription, though free trials are available for learning and experimentation. Subscriptions provide enterprise features ideal for scalable data pipelines and Lakehouse analytics.
Yes! Corporate invoices are available. You can pay via company card or forward an invoice to your finance team.
These options are available on the Sign-Up form.
Yes, discounts are available for teams of 5 or more. Customized corporate training is also offered.
Contact us for group pricing.
Roles include:
These roles are in high demand in technology, finance, healthcare, and e-commerce industries.
Choose based on your organization’s cloud stack and your role goals. Databricks is ideal for engineers working with large-scale, real-time data and modern Lakehouse architectures.
Yes! Hands-on projects cover end-to-end pipelines, cloud integration, Delta Lake management, and real-time analytics—giving you job-ready experience.
Yes. Tool-specific certificates are awarded for Databricks, Delta Lake, SQL, and Power BI, plus a master certificate: “Data Engineering & BI: Databricks Expert.”
Live, instructor-led classes include exercises, real-world case studies, and Q&A sessions to ensure practical learning.
No. This is a live interactive course, but you’ll receive assignments, templates, and documentation for practice.
Class notes and exercises are provided to catch up, and you can attend the same session in a future batch (subject to availability).
Yes, sessions can be retaken in future batches; full re-enrollment may require an additional fee.
Unlike pre-recorded courses, you’ll work on real-world Databricks datasets with expert guidance and personalized feedback, making it more practical and career-focused.
More questions ?
End-to-End Data Pipelines
Cloud Data Integration
Real-Time Processing
Data Modeling & Transformation
Lakehouse & Delta Table Management
Data Visualization
Cloud Workflow Automation
ETL Optimization
AI-Driven Analytics
Data Governance & Security
Cloud Analytics Collaboration
Scalable Solution Design
Mr. Sami is an exceptionally accomplished and certified Microsoft Trainer, possessing extensive expertise in the fields of Finance, HR, and Information Technology. With an impressive 14-year tenure in the industry, he has successfully trained and empowered over 23,000 professionals, and the number continues to grow.
He has undertaken assignments with the renowned IRS, The World Bank, Tata Chemicals, Buckman Laboratories, Standard Chartered, ING Barings and much more. His nature of going that Extra Mile has got him the startling popularity amongst the Excelgoodies prominent clients.
Government Institutions We've Worked With.
Build Real-World Solutions During the Course
We Spot Trends Before They Become Industry Standards
The analytics industry moves fast. We move faster. We constantly update our courses to match the latest industry needs, so you’re always learning what’s in demand—before everyone else.
Learn What Matters, Not Just What’s Trending
BI & Analytics isn’t about knowing one tool—it’s about knowing how to use the right tools together. Our courses don’t just teach software; they teach end-to-end reporting, automation, and cloud-driven analytics workflows—exactly what businesses need.
Tech-Enabled Learning,
Zero Hassles
Forget scattered emails and outdated PDFs. Our AI-powered student portal keeps everything in one place—live classes, assignments, progress tracking, instructor feedback, invoices, and instant support—so you stay focused on learning.
Real Projects, Real Experience, Real Confidence
No more theory-only learning—you’ll walk out of our courses with proven expertise in the tools and techniques hiring managers want.
Mr. Perrie Smith
Business Associate
Overall really enjoyed the course. Nice balance between demos, guided practice and independent practice. I really enjoyed the exercises where criteria was displayed and we had 20 minutes to build it up. Content felt very heavy on dashboard creation with an accelerated run thru PowerQuery material in the last several days; I think this could be a bit more balanced. My company had 5 students with stronger use needs for automated data manipulation than db's. The SQL review on Day10 was a bit fuzzy, I couldn't quite follow the benefits or use cases where this would be relevant. I would recommend adding a 5min break to the middle of each session for biological needs; 2.5 hrs is a long shot for some folks. We spent about 5 minutes at the beginning of each lesson setting up the day's folder structure, copying over data sets, etc. Could eliminate this and replace with a break if the overall folder structure was distributed with data sets already loaded in place at start of course. I.e. send zipped structure with folders for Days 1-10, each containing the ""Project X - Dashboard"" subfolders with Sales.Data.csv, etc, already saved in place. Thanks for the experience! looking forward to applying the knowledge!
Delaney Sullivan | Finance Transformation Project Manger | American Tower | United States (Power BI Training)
I had a little experience with Power BI prior to the class. The information given greatly expanded my knowledge and I am excited to put the knowledge to use. Sami's instructions were very easy to follow and he made sure to answer everyone's questions. The only issue I had with the course was with the students not the instructor or course itself. It was a bit frustrating when some of the students were not prepared (especially not having the system requirements installed) and we had to wait for them to download materials or software. Sami handled it professionally but it took away time that could have been used for training. Overall, I am very please with what I have learned and will be looking into taking the Full Stack BI training. Thank You, Iris Bradshaw
Iris Bradshaw | Data Analyst | Qnnect | United States (Power BI Training)
I liked the pace and content of this introduction to Power BI. The instructor was able to quickly troubleshoot most issues that people had, although some problems did stall the pace quite a bit at times (participants really should have a strong Excel skillset and ability to manage files). Perhaps on a daily basis before the training , a quick 'setup' email would be helpful (which folders to create and which files to copy) so that everyone could set themselves up ahead of time. (Or include day-by-day setup instructions in the content zip file with this info.) On another note, I would like to have spent more time on publishing and refreshing published reports (and the Power BI workspace) instead of the SQL server mini course. As it was, though, the lessons we learned in this training will be almost immediately applied and the results should be very helpful to people in my organization looking for dashboard summaries of their data. Thank you.
Michele Sabatino | Data Analytics Manager | Harbor Health | United States (Power BI Training)
Sami did a great job introducing the basics of Power BI through instruction and hands-on learning. This is a good course for a complete beginner, and would probably benefit some early intermediate students as well. My only complaint would be the amount of time needed to troubleshoot so many students' technical issues. We probably spend 40% of the total class time with Sami troubleshooting. It's not a knock on Sami or the course. Maybe a slightly smaller class would make it a little easier.
Zane Kinsey | Business Controller | Pacific Power Group | United States (Power BI Training)
This training was great! I've been working with Power BI for a little while now but was mostly self-taught so it was nice to learn some best practices for the way to do things. Also good to learn more about DAX and Power Query. Thank you Sami!
Michael Morrison | Platform Analyst | Cross First Bank | United States (Power BI Training)
Delaney Sullivan
Power BI Training
Finance Transformation Project Manger
American Tower
United States
Overall really enjoyed the course. Nice balance between demos, guided practice and independent practice. I really enjoyed the exercises where criteria was displayed and we had 20 minutes to build it up. Content felt very heavy on dashboard creation with an accelerated run thru PowerQuery material in the last several days; I think this could be a bit more balanced. My company had 5 students with stronger use needs for automated data manipulation than db's. The SQL review on Day10 was a bit fuzzy, I couldn't quite follow the benefits or use cases where this would be relevant. I would recommend adding a 5min break to the middle of each session for biological needs; 2.5 hrs is a long shot for some folks. We spent about 5 minutes at the beginning of each lesson setting up the day's folder structure, copying over data sets, etc. Could eliminate this and replace with a break if the overall folder structure was distributed with data sets already loaded in place at start of course. I.e. send zipped structure with folders for Days 1-10, each containing the ""Project X - Dashboard"" subfolders with Sales.Data.csv, etc, already saved in place. Thanks for the experience! looking forward to applying the knowledge!
Iris Bradshaw
Power BI Training
Data Analyst
Qnnect
United States
I had a little experience with Power BI prior to the class. The information given greatly expanded my knowledge and I am excited to put the knowledge to use. Sami's instructions were very easy to follow and he made sure to answer everyone's questions. The only issue I had with the course was with the students not the instructor or course itself. It was a bit frustrating when some of the students were not prepared (especially not having the system requirements installed) and we had to wait for them to download materials or software. Sami handled it professionally but it took away time that could have been used for training. Overall, I am very please with what I have learned and will be looking into taking the Full Stack BI training. Thank You, Iris Bradshaw
Michele Sabatino
Power BI Training
Data Analytics Manager
Harbor Health
United States
I liked the pace and content of this introduction to Power BI. The instructor was able to quickly troubleshoot most issues that people had, although some problems did stall the pace quite a bit at times (participants really should have a strong Excel skillset and ability to manage files). Perhaps on a daily basis before the training , a quick 'setup' email would be helpful (which folders to create and which files to copy) so that everyone could set themselves up ahead of time. (Or include day-by-day setup instructions in the content zip file with this info.) On another note, I would like to have spent more time on publishing and refreshing published reports (and the Power BI workspace) instead of the SQL server mini course. As it was, though, the lessons we learned in this training will be almost immediately applied and the results should be very helpful to people in my organization looking for dashboard summaries of their data. Thank you.
Zane Kinsey
Power BI Training
Business Controller
Pacific Power Group
United States
Sami did a great job introducing the basics of Power BI through instruction and hands-on learning. This is a good course for a complete beginner, and would probably benefit some early intermediate students as well. My only complaint would be the amount of time needed to troubleshoot so many students' technical issues. We probably spend 40% of the total class time with Sami troubleshooting. It's not a knock on Sami or the course. Maybe a slightly smaller class would make it a little easier.
Michael Morrison
Power BI Training
Platform Analyst
Cross First Bank
United States
This training was great! I've been working with Power BI for a little while now but was mostly self-taught so it was nice to learn some best practices for the way to do things. Also good to learn more about DAX and Power Query. Thank you Sami!
I recently completed the Power BI training, and it was an excellent learning experience. The course was well-structured, covering everything from basic visualization techniques to advanced DAX functions. The instructor was highly knowledgeable and explained complex concepts in a clear and practical manner.
Sami was a great instructor. He took the time to make sure everyone could follow along and understand the material. While I already had experience with Power BI prior to this course, it was still a great refresher. If you're new to Power BI this is a great course to take!
Sami, our trainer, was really good. He was very thorough in explaining concepts as well as navigating the user interface. He kept a good pace while ensuring that nobody was left behind . I recommend this course.