How Do You Build an End-to-End Data Pipeline in Microsoft Fabric Using Lakehouse, Warehouse & Power BI?
If you're exploring Microsoft Fabric, you’ve probably heard one promise again and again:
“You can build your entire analytics pipeline — ingestion to reporting — inside one platform.”
But how does that actually work? How do you build a real end-to-end pipeline using:
Fabric Lakehouse (for storage & transformations)
Fabric Warehouse (for SQL-based modeling)
Power BI (for reporting & visuals)
Let’s break it down in a way that any data engineer, BI developer, or analytics lead can understand — clearly and practically.
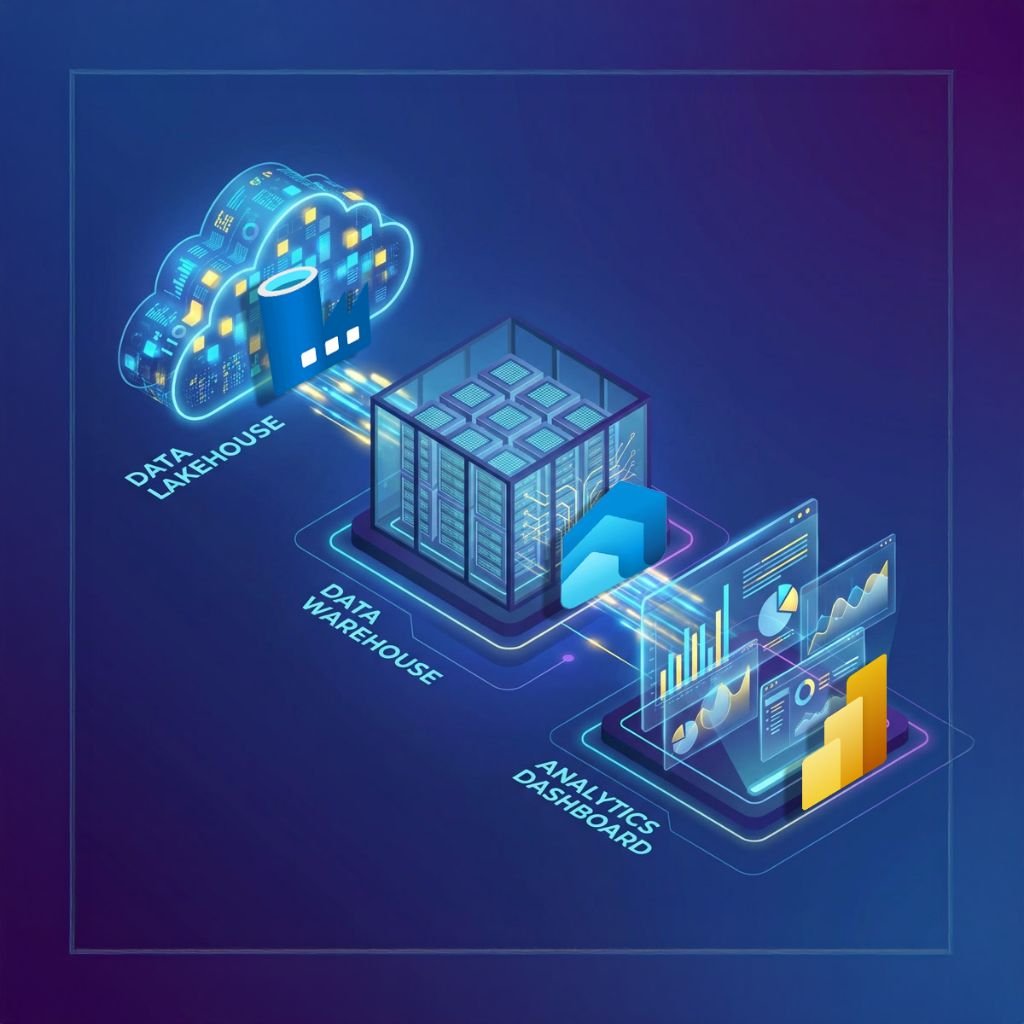
The Real-World Flow
A typical Fabric pipeline looks like this:
Ingest Data → Lakehouse (Bronze)
Clean & Transform using Spark or Dataflows → Lakehouse (Silver)
Curate & Model → Warehouse (Gold)
Expose to Power BI → Semantic Model
Build Dashboards → Power BI Reports
One platform. One storage layer. One pipeline.
Now let’s walk through the steps in real words.
STEP 1: Ingest Data into the Lakehouse (Bronze Layer)
Your Lakehouse is your “single source of truth” for raw and semi-raw data. You can ingest data using:
Option A: Data Pipelines (Fabric Data Factory)
Best for structured sources like:
SQL Server
Oracle
Snowflake
Salesforce
APIs
You create a pipeline → choose “Copy Data” → dump it into your Lakehouse.
Option B: Dataflows Gen2
Best for:
Excel files
CSVs
OneDrive/SharePoint sources
Think of this as Power Query on steroids.
Option C: Spark Notebooks
Best for:
Complex ingestion logic
Streaming
Data from blob storage
Incremental ingestion with Delta
At the end of step 1, your Bronze folder will have raw Delta tables.
STEP 2: Transform Data in the Lakehouse (Silver Layer)
Now we clean, standardize, and structure it. You can use:
A. Spark Notebooks (PySpark, Scala, or SQL)
Perfect for:
Deduplication
CDC logic
Complex joins
Partitioning
Writing Delta tables
B. Dataflows Gen2
Perfect for:
Business-friendly transformations
No-code data shaping
Mapping logic
Basic cleanup
C. SQL in the Lakehouse (SQL Endpoint)
Perfect for:
Simplified joins
Dimension / fact structures
Materializing curated tables
Your Silver tables are now analytics-ready but not fully modeled. Following a structured Fabric Engineering training can help your team confidently design Warehouse tables, optimize transformations, and set up semantic models correctly.
STEP 3: Publish Curated Data into the Warehouse (Gold Layer)
This is where Fabric becomes magical. Your Warehouse and Lakehouse share OneLake storage, which means:
Zero data movement
Zero duplication
Instant queries across layers
There are two main patterns here:
Pattern 1: Shortcut Lakehouse → Warehouse
Create a shortcut from your curated Lakehouse Silver table into the Warehouse. This gives you SQL-optimized access to the exact same Delta file.
Pattern 2: Create Analytical Fact/Dimension Tables Directly in the Warehouse
Use SQL to build:
DimDate
DimCustomer
FactSales
FactOrders
etc.
Your Warehouse becomes the business-ready layer (Gold).
STEP 4: Create a Power BI Semantic Model (Automatically!)
Here’s the best part. As soon as your Warehouse is ready:
Fabric automatically creates a Power BI semantic model on top of it.
No extra steps.
No manual dataset creation.
You’ll see it under your Warehouse item: “Default semantic model”
From here, you can:
Add relationships
Define measures (DAX)
Create hierarchies
Add role-level security
It behaves exactly like a Power BI dataset — because it is.
STEP 5: Build Dashboards in Power BI
Finally, use Power BI Desktop or Power BI in Fabric to build:
Scorecards
Reports
Dashboards
Real-time visuals
DirectLake mode gives you:
Warehouse-level performance
Lakehouse-level freshness
Zero import/time refresh
Massive scalability
Your full pipeline is now running, end-to-end.
What Does an End-to-End Fabric Pipeline Look Like in the Real World?
Here’s a typical example:
Sales data ingested nightly from SQL Server → Lakehouse Bronze
Cleaned & joined with product & customer data → Lakehouse Silver
Fact and dimension tables created → Warehouse Gold
Power BI semantic model auto-generated
Finance dashboards built in Power BI
Refreshed automatically using DirectLake
Everything runs inside one ecosystem.
No data movement.
No silos.
No “15 different tools for 15 different stages.”
Final Takeaway
Building an end-to-end pipeline in Fabric is surprisingly clean once you understand the Lakehouse → Warehouse → Power BI flow.
Fabric finally gives modern data teams what they’ve always wanted:
A unified analytics platform
A single storage engine (Delta + OneLake)
CI/CD support
Strong governance
Auto-integration with Power BI
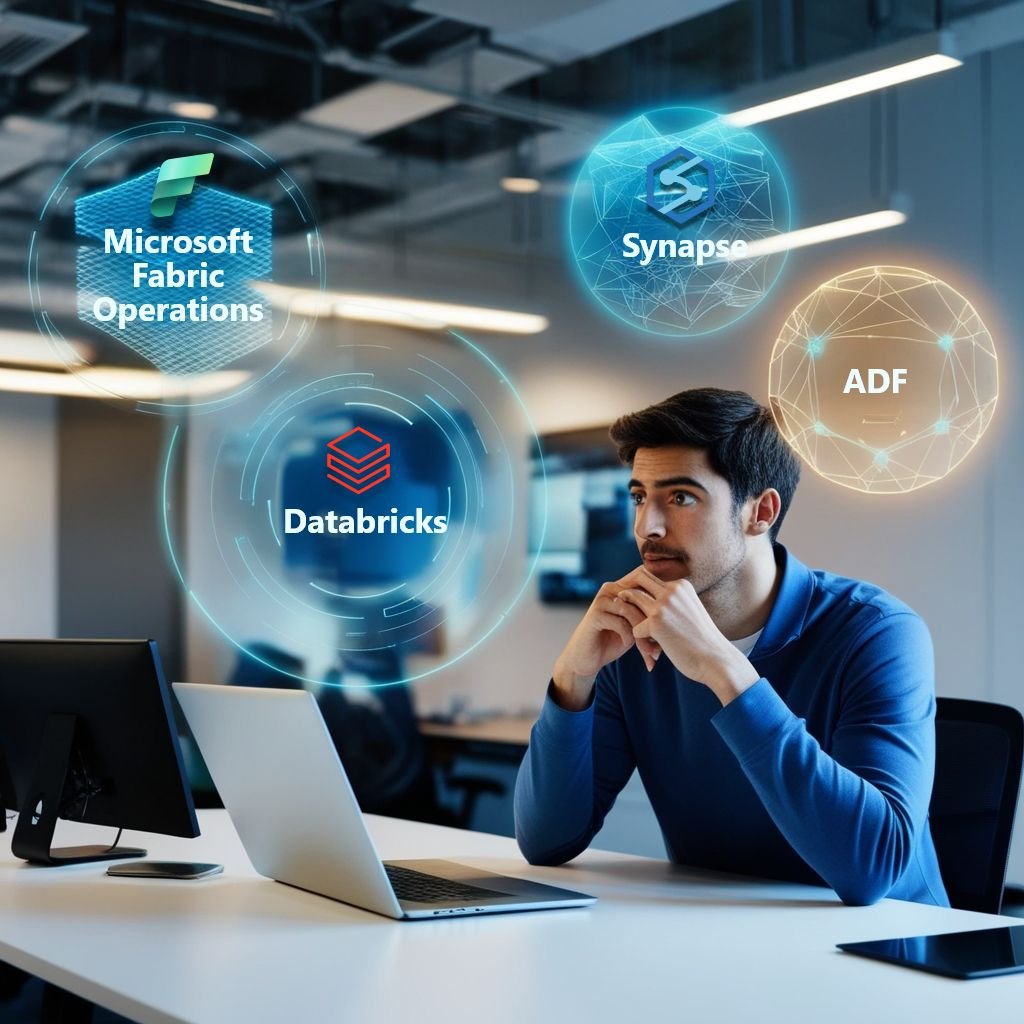
It’s everything Synapse + ADF + Power BI always wanted to be — in one place.
Editor’s Note
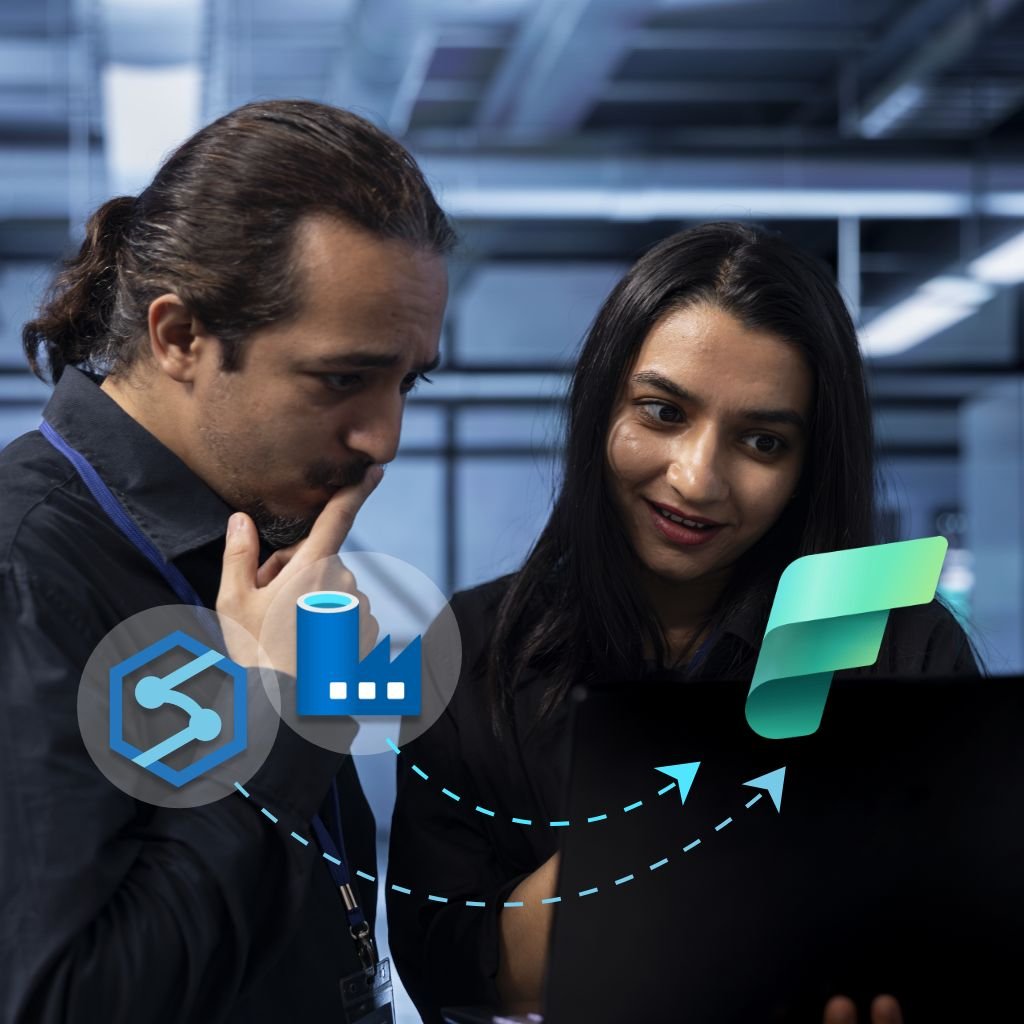
If you’re starting your Fabric journey, especially with end-to-end pipelines, it’s crucial to understand Lakehouse modeling, Warehouse design, Spark optimization, and semantic layer best practices. These skills determine whether your Fabric project becomes a smooth success or a frustrating experiment.
Our Fabric Data Engineering Training is designed exactly for teams migrating from ADF/Synapse or starting fresh in Fabric — with hands-on, real-world pipeline projects and guided coaching.


 Power BI
 SQL
SQL Power Apps
 Power Automate
 Microsoft Fabrics
 Azure Data Engineering