Top 5 Power BI Best Practices for New York Startups
Power BI: The Secret Weapon for NYC Startups
Speed is everything in New York's fast-paced startup world, and data is the only advantage you can play with. The difference between success and failure often comes down to who can move the quickest. That's why many founders in NYC are turning to Power BI as an important tool.
Moreover, it's affordable, it lives in the cloud, and it's a powerful tool that transforms complex data into clear, actionable insights, helping their teams stay ahead.
Getting Power BI running is only the first step. The real challenge is using it effectively. Power BI can help New York startups work smarter, grow faster, and operate more efficiently—here are five best practices to follow.
1. Start with the Right Data Model
Startups often focus on building slick dashboards, but without a strong data model, they don’t stand the test of time.
Best Practice: Make sure that your data is clean and well organized. Normalize your tables where necessary to avoid redundancy, clearly define the relationships between different datasets, and use a star schema design whenever it fits your reporting needs. This structured approach always keeps your dashboards scalable, accurate, and easy to maintain as your data expands
Example: A SoHo-based e-commerce startup organized its data using a simple star schema, with Orders as the fact table and Customers, Products, and Dates serving as dimension tables. That solid foundation made it easy to scale. With transaction volumes rising from 1,000 to 50,000 monthly, their reporting system continued to deliver accurate and trustworthy results
2. Keep Dashboards Lean and Focused
Overloading a single screen with lots of information often leads to poor decision-making. That’s why overloaded dashboards get confused.
Best Practice: Maintain a clean dashboard by using 3–5 visuals per page, each designed around a key business decision
Example: A Brooklyn fintech found that their investor update dashboard, packed with 14 visuals, was confusing and difficult to read. By reducing it down to 5 key visuals, the reports became clearer, easier to navigate, and far more effective in presentations. The outcome? Investors can now quickly see important metrics like monthly active users, churn rate, and burn rate—without sorting through irrelevant data.
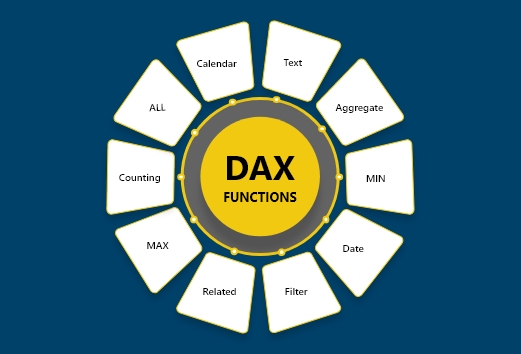
3. Leverage DAX for Business Insights
Power BI works best with Data Analysis Expressions (DAX). With the right formulas, startups can build their insights beyond simple sums and averages.
Best Practice: To keep the reports effective, try to use calculated measures, not calculated columns.
Example: A health-tech startup in Manhattan used DAX to create a measure that calculated “Customer Lifetime Value” based on repeat purchase frequency. This insight directly shaped their marketing budget decisions.
4. Automate Data Refreshes
Manual updates often reduce efficiency and make outdated information more likely.
Best Practice: Try to use scheduled refresh in Power BI Service to make sure decision-makers always see the live data.
Example: A Tribeca-based SaaS startup connected Power BI to their Stripe and HubSpot data. By setting up daily refreshes, their sales and support teams shifted from outdated reporting to real-time insights that led to faster action.
5. Design for Scalability and Collaboration
The initial dashboards a startup creates often don’t hold up as the business grows. Planning for scale saves time and money later.
Best Practice: Use shared datasets, role-level security (RLS), and standard naming conventions for fields.
Example: A food delivery startup in Queens designed role-level security so restaurant partners could log in and see only their performance metrics. It meant no more building individual reports for each partner
Final Thoughts
New York startups that prioritize speed and agility can gain a real advantage with Power BI when it’s used effectively.
By building solid data models and leveraging DAX smartly, teams spend less time wrestling with spreadsheets and more time making decisions that drive growth.
Editor’s Note
If you’re a startup founder, data analyst, or operations lead looking to sharpen your Power BI skills, consider structured training. Our Power BI: Data Analytics with Advanced DAX & Power Query course is designed to take you from fundamentals to advanced reporting in just weeks. Many of our participants are professionals from New York startups who wanted to bridge the gap between raw data and actionable insights.


 Power BI
 SQL
SQL Power Apps
 Power Automate
 Microsoft Fabrics
 Azure Data Engineering