How Do I Transition from Excel/SQL to Power BI — Career Path and Certification (PL-300)?
If you already work with Excel or SQL, you’re closer to mastering Power BI than you think. In fact, most successful Power BI professionals started right where you are using Excel for reports or SQL for data handling and gradually transitioned into full BI development.
This blog walks you through that journey from Excel to Power BI and explains how you can build job-ready skills, step-by-step, along with insights on the Microsoft Power BI Data Analyst Certification (PL-300).
1. Why Transition to Power BI?
The data industry is moving beyond spreadsheets and static reports. Companies want interactive dashboards, automated insights, and centralized data models — and Power BI delivers exactly that.
If you already know Excel or SQL, you have two key advantages:
You understand data cleaning, modeling, and formulas (Excel)
You understand data relationships, joins, and queries (SQL)
Power BI combines both data manipulation + data visualization in a single platform. Think of Power BI as Excel and SQL working together — but smarter, faster, and built for scale.
2. The Roadmap: From Excel or SQL to Power BI
Here’s a practical roadmap professionals can follow:
Step 1: Strengthen Excel Foundations (Optional but Useful)
If you come from Excel: polish your skills in formulas (VLOOKUP, INDEX-MATCH, XLOOKUP), tables, PivotTables, and Power Query (Get & Transform).
If you come from SQL: focus on joining datasets and working with structured queries, since that translates directly to Power BI’s modeling logic.
Step 2: Learn Power Query (ETL Layer) Power Query is where data cleaning happens. Learn how to:
Connect to different data sources
Transform messy Excel/CSV/SQL data
Merge and append datasets
Create reusable query steps
Pro Tip: Excel users often feel “at home” here — the UI and formula concepts are familiar.
Step 3: Build Data Models (The Core of Power BI) Next, you’ll create relationships between tables and design your data model. Learn concepts like:
Star Schema
Fact vs. Dimension tables
Relationships (one-to-many, many-to-one)
Filter context
A good model ensures your dashboards remain accurate and performant.
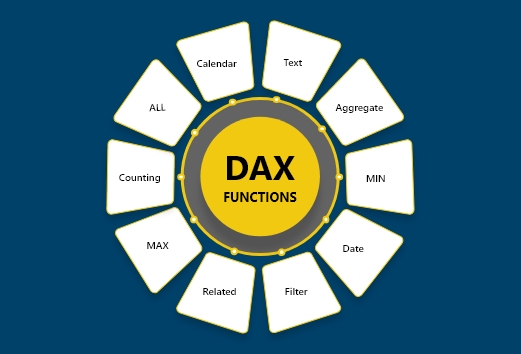
Step 4: Master DAX (Formulas in Power BI) DAX (Data Analysis Expressions) is where most professionals truly level up. Start with basics like:
CALCULATE()
FILTER()
SUMX(), AVERAGEX(), VALUES()
Then progress to time intelligence functions like TOTALYTD, SAMEPERIODLASTYEAR, and DATEADD.
If you’re from Excel, think of DAX as your new formula language — but way more powerful.
Step 5: Design Interactive Dashboards This is where your storytelling skills shine. Learn to:
Use visuals effectively
Apply themes and bookmarks
Build user-friendly navigation
Add slicers, filters, and drill-through actions
Step 6: Publish and Automate Deploy your dashboards to the Power BI Service, set up scheduled refreshes, and manage workspace permissions. If you want to go further, explore Power Automate & Power Apps Course for automation and app-based workflows.
3. PL-300: Microsoft Power BI Data Analyst Certification
Once you’ve mastered the basics, the PL-300 certification is the official recognition of your skills.
What it validates:
Data preparation and modeling
Data visualization and analysis
Managing workspaces and datasets
Applying best practices for performance
Exam Structure:
Duration: ~100 minutes
Format: Multiple choice + case studies
Prerequisites: None (but Power BI experience recommended)
Study Path:
Learn Power BI Desktop (start with the Excelgoodies Power BI course)
Get hands-on with DAX, Power Query, and data modeling
Practice with Microsoft Learn modules and PL-300 sample tests
Build a few real-world dashboards from open datasets (Kaggle, public APIs)
Power BI has become one of the most in-demand BI tools globally, and professionals with both Excel/SQL and Power BI skills are highly valued.
Popular job roles include:
Power BI Data Analyst
Business Intelligence Developer
Data Visualization Specialist
Reporting & Automation Engineer
Average Salary (U.S.): USD 85,000–125,000 per year, depending on experience and automation exposure.
5. Bonus Tip — Automate and Go Full-Stack
Once you’re comfortable with Power BI, expand your skills into Power Automate (for workflow automation) and Power Apps (for form-based data entry). This trio — Power BI + Power Automate + Power Apps — transforms you from a report builder into a Full Stack Power Platform professional, capable of building entire business solutions end-to-end.
Editor’s Note
This article is part of our “Power BI Community Questions Explained” series based on real user queries across Reddit, Quora, and the Microsoft Power BI Community.
If you’re transitioning from Excel or SQL and want to accelerate your career in analytics, explore our hands-on training programs at Excelgoodies. Our Power BI Reporting and Full Stack BI Reporting & Automation course take you from fundamentals to automation — covering Power BI, SQL, Power Query, DAX, Power Automate, and Power Apps — with live instructor-led sessions and real projects that mirror the PL-300 certification path.


 Power BI
 SQL
SQL Power Apps
 Power Automate
 Microsoft Fabrics
 Azure Data Engineering